Page 21 - text book form physics kssm 2020
P. 21

Chapter 1
                                                                                               Measurement
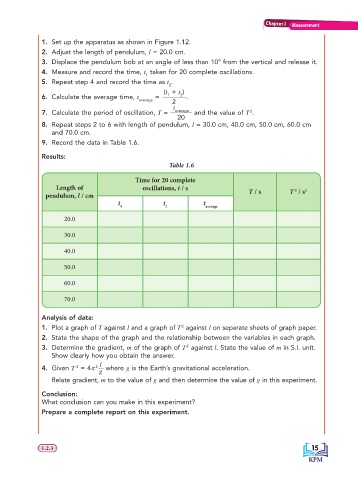
                   1.  Set up the apparatus as shown in Figure 1.12.
                   2.  Adjust the length of pendulum, l = 20.0 cm.
                   3.  Displace the pendulum bob at an angle of less than 10º from the vertical and release it.
                   4.  Measure and record the time, t  taken for 20 complete oscillations.
                                                   1
                   5.  Repeat step 4 and record the time as t .
                                                          2
                                                        (t  + t )
                   6.  Calculate the average time, t average  =   1  2  2  .
                                                           t
                                                                                  2
                   7.  Calculate the period of oscillation, T =   average   and the value of T  .
                                                            20
                   8.  Repeat steps 2 to 6 with length of pendulum, l = 30.0 cm, 40.0 cm, 50.0 cm, 60.0 cm
                      and 70.0 cm.
                   9.  Record the data in Table 1.6.
                   Results:

                                                          Table 1.6
                                               Time for 20 complete
                        Length of                 oscillations, t / s                          2  2
                    pendulum, l / cm                                              T / s       T  / s
                                           1             2           average
                                          t             t           t
                          20.0

                          30.0

                          40.0

                          50.0

                          60.0

                          70.0

                   Analysis of data:
                   1.  Plot a graph of T against l and a graph of T   against l on separate sheets of graph paper.
                                                             2
                   2.  State the shape of the graph and the relationship between the variables in each graph.
                                                               2
                   3.  Determine the gradient, m of the graph of T   against l. State the value of m in  S.I. unit.
                      Show clearly how you obtain the answer.
                   4.  Given T  = 4π 2 l  where g is the Earth’s gravitational acceleration.
                              2
                                     g
                      Relate gradient, m to the value of g and then determine the value of g in this experiment.
                   Conclusion:
                   What conclusion can you make in this experiment?
                   Prepare a complete report on this experiment.


                   1.2.3                                                                             15 15
                   1.2.3
   16   17   18   19   20   21   22   23   24   25   26