
Page 22 - text book form physics kssm 2020
P. 22
Discussion:
1. Why does the time for 20 complete oscillations need to be taken in this experiment?
2. Why is the measurement of time taken for 20 complete oscillations repeated?
3. State one precaution that should be taken to increase the accuracy of the results of
this experiment.
4. Compare the value of g obtained from this experiment with the standard value of g,
that is 9.81 m s . Justify the difference in the values of g.
–2
Formative Practice 1.2
1.2
1. Graphs play an important role in scientifi c investigations.
(a) What are the uses of graphs?
(b) Explain the main steps taken in the process of plotting a graph.
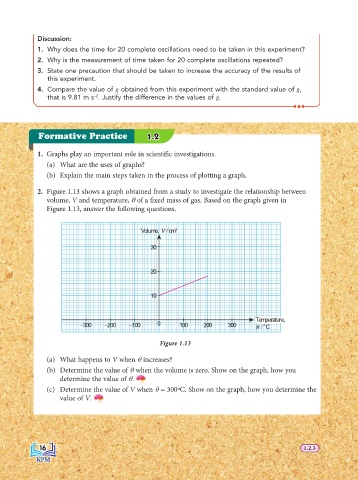
2. Figure 1.13 shows a graph obtained from a study to investigate the relationship between
volume, V and temperature, θ of a fi xed mass of gas. Based on the graph given in
Figure 1.13, answer the following questions.
Volume, V / cm 3
30
20
10
Temperature,
–300 –200 –100 0 100 200 300 / °C
θ
Figure 1.13
(a) What happens to V when θ increases?
(b) Determine the value of θ when the volume is zero. Show on the graph, how you
determine the value of θ.
(c) Determine the value of V when θ = 300ºC. Show on the graph, how you determine the
value of V.
16 16 1.2.3
1.2.3