
Page 54 - Human Environment Interface (4)
P. 54
Epigenetics of the Placenta
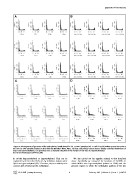
Figure 2. Histograms of genome wide methylation levels (Beta) in (A) 12 MBC samples (B) 12 cell lines (C) Primary ovarian tumors
and (D) 12 CVS samples based on the Illumina Infinium data. MBCs, cell lines and primary ovarian tumors display a bimodal distribution of
hyper and hypomethylation, CVS genomes have a dramatic reduction in the number of loci that are hypermethylated.
doi:10.1371/journal.pone.0014723.g002
be strictly hypermethylated or hypomethylated. This can be We also carried out the opposite analysis to that described
explained by the fact that CGIs are, by definition, regions where above. Specifically we compared the locations of T-DMRs in
CpGs are hypomethylated [32]. Therefore, they are unlikely to be which MBCs were hypomethylated (relative to CVS) with the
common sites of tissue specific methylation. genomic regions in which the methylation patterns of the two
PLoS ONE | www.plosone.org 6 February 2011 | Volume 6 | Issue 2 | e14723