
Page 57 - Human Environment Interface (4)
P. 57
Epigenetics of the Placenta
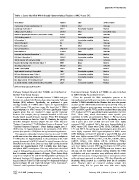
Table 1. Genes Identified Within Broadly Hypomethylated Regions of MBC Versus CVS.
Gene Names Symbol Type Active Location
Chromosome 18 open reading frame 18 C18ORF18 Other Unknown
Caudal type homeobox 2 CDX2* Transcription regulator Nucleus
Collagen, type IV, alpha 2 COL4A2 Other Extracellular Space
Deleted in lymphocytic leukemia 2 (non-protein coding) DLEU2 Other Unknown
GATA binding protein 6 GATA6* Transcription regulator Nucleus
GS homeobox 1 GSX1 Transcription regulator Nucleus
Neurocanthocytosis NA Other Unknown
Neurocanthocytosis NA Other Unknown
One cut homeobox 2 ONECUT2* Transcription regulator Nucleus
Protocadherin 17 PCDH17 Other Unknown
Pancreatic and duodenal homeobox 1 PDX1 Transcription regulator Nucleus
POU class 4 homeobox 1 POU4F1 Transcription regulator Nucleus
RAB20, member RAS oncogene family RAB20 Enzyme Cytoplasm
Receptor-interacting serine-threonine kinase 4 RIPK4 Kinase Nucleus
Ring finger protein 219 RNF219 Other Unknown
Sal-like 3 (Drosophila) SALL3* Other Nucleus
Single-minded homolog 2 (Drosophila) SIM2 Transcription regulator Nucleus
SRY (sex determining region Y)-box 1 SOX1* Transcription regulator Nucleus
SRY (sex determining region Y)-box 21 SOX21 Transcription regulator Nucleus
Zinc finger protein 161 homolog (mouse) ZFP161 Other Nucleus
Zic family member 2 (odd-paired homolog, Drosophila) ZIC2* Transcription regulator Nucleus
doi:10.1371/journal.pone.0014723.t001
Pathway Analysis Reveals that T-DMRs are Enriched for Functional Groups Enriched in T-DMRs are also Enriched
Distinct Functional Groups in Differentially Transcribed Genes
To further explore the relationship between T-DMRs and gene Given the potential for DNA methylation patterns to be
function we analyzed the Illumina data using Ingenuity Pathways intimately associated with gene expression, we sought to determine
Analysis (IPA) software. Specifically, we performed a gene whether T-DMRs identified in the Illumina data were also present
ontology analysis of T-DMRs where CpGs are hypomethylated as tissue specific differentially transcribed genes (TDTs). Thus, we
in MBC versus CVS and vice versa. We found that T-DMRs analyzed Affymetrix gene expression microarray data to identify
hypomethylated in MBC versus CVS were significantly biased CVS- and MBC-specific TDTs and then analyzed these data using
towards genes that are involved in tissue specific leukocyte IPA. A sub-set of TDTs was validated using quantitative real time
function. For example, the top networks identified in IPA were PCR. These data, which demonstrate tissue specific gene
heavily biased towards immune function. These IPA-designated expression in CVS, are presented in Figure 7. We found very
enriched networks are listed in Table S1. Similarly, the top IPA- little overlap between T-DMRs and TDTs. Specifically, we found
identified biological functions (Figure 6A and Table S2) were only 6 genes (of a total of 207) that were both more highly
‘‘Antigen Presentation’’, ‘‘Cell Mediated Immune Response’’ and expressed AND contained CpGs that were hypomethylated in
‘‘Humoral Immune Response’’. These findings suggest that T- MBC versus CVS. These were CD48, CD52, CMTM2, CST7,
DMRs that are hypomethylated in the promoters of the MBC LYZ and NFE2. No overlap was found between genes that were
genome (compared to CVS) have strong functional significance. more highly expressed AND hypermethylated in MBC versus
CVS. Similarly, we found 14 genes (of a total of 643) that were
This apparent relationship between tissue function and T-DMR both more highly expressed AND hypomethylated in CVS versus
profile was not so clear when we performed the same analysis on MBC. These were ANGPT2, CDH1, COL3A1, CRIM1, CSH2,
T-DMRs that are hypomethylated in the promoters of the CVS ENPEP, GCM1, H19, INSL4, KRT8, LGALS14, PGM3,
genome (compared to MBC). It should be noted, however, that we SLC16A4 and STS. No overlap was found between genes that
identified more than three times as many high scoring networks were more highly expressed AND hypermethylated in CVS versus
amongst the hypomethylated CVS T-DMRs than their hypo- MBC. The fact that such minimal overlap was seen between data
methylated MBC counterparts. This may reflect both the broad sets was not the result of minimal overlap between the DNA
range of biological functions performed in/by CVS and the fact methylation and gene expression array platforms, which contain
that it contains multiple distinct cell types. These factors likely 11,337 common genes. It may, however, be a consequence of our
conspire to complicate the task of identifying distinct pathways and rather stringent approach to selecting TDTs (see Materials and
biological functions. IPA-designated enriched networks for these Methods), which resulted in a relatively short list of candidate
data are listed in Table S3. High scoring IPA-designated biological genes. However, when we compared pathway analysis data
functions (Figure 6B and Table S4) include ‘‘Gene Expression’’, obtained using IPA for genes that were both more highly
‘‘Cancer’’ and Organismal Development’’.
PLoS ONE | www.plosone.org 9 February 2011 | Volume 6 | Issue 2 | e14723