
Page 56 - Human Environment Interface (4)
P. 56
Epigenetics of the Placenta
Figure 3. Top: Moving average of the hypomethylation levels of the MspI sites levels in CVS (solid line) and MBC (dashed line).
Middle: Moving average of the difference in the hypomethylation levels of the MspI sites between CVS and MBC. The short dense vertical lines above
the X axis (appearing as a solid horizontal line) in both the top and bottom panels represent locations of the MspI sites in each chromosome. Bottom:
Histogram of the EST and mRNAs aligned to the chromosome generated using NCBI genome Map Viewer. (A) Chromosome 13. (B) Chromosome 18.
(C) Chromosome 21.
doi:10.1371/journal.pone.0014723.g003
tissues did not show significant difference. We found that, such sites in MBC were slightly more likely to be outside (than
generally, these T-DMRs were less likely to exist inside CGIs inside) gene bodies (Figure 5A). The pattern for promoters was
(Figure 4C) and exons (Figure 4D), and slightly more likely to exist very clear. Using the Fisher’s exact test, we found that
inside gene bodies and promoter regions (Figure 4A and B hypomethylated sites were much more likely to be inside
respectively). However, we note that the results are much less promoters than other sites. This was true for both CVS and
significant than those discussed above, mainly because we found MBC (Figure 5B). The patterns for CGIs and exons were
much fewer (812) sites where MBC was hypomethylated similar to the pattern for promoters. Specifically, hypomethy-
compared to CVS than the 5,499 sites where CVS was lated sites were much more like to be inside CGIs or exons, as
hypomethylated compared to MBC[24]. oppose to outside CGIs or inside introns, than the non-
hypomethylated sites. This was true for both CVS and MBC
Hypomethylated Regions of the CVS and MBC Are More (Figure 5C and D). We also found that sites hypomethylated in
Likely to be in CGIs, Promoters and Exons MBC were even more likely than in CVS to be inside (as
oppose to outside) a promoter or CGI, which partly explains
We next considered CpGs that were hypomethylated in CVS why sites more hypomethylated in CVS than in MBC were
(relative to the rest of the CVS genome) and/or hypomethy- more like to be outside of CGI and promoter than sites more
lated in MBCs (relative to the rest of the MBC genome). Those hypomethylated in MBC than in CVS.
sites in gene bodies showed no clear pattern in CVS whereas
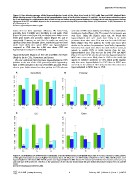
Figure 4. Distributions of differentially methylated and non-differentially methylated MspI sites in various structural components
of the genome based on custom Agilent microarray data. OT: MspI sites not differentially methylated in CVS vs. MBC. CM: MspI sites more
hypomethylated in CVS than in MBC. MC: MspI sites more hypomethylated in MBC than in CVS. Data are presented for each chromosome (13, 18, 21),
and each type of MspI sites (OT, CM, MC), as the proportions of sites that are located inside (A) gene bodies (B) promoter regions (C) CGIs and (D)
exons.
doi:10.1371/journal.pone.0014723.g004
PLoS ONE | www.plosone.org 8 February 2011 | Volume 6 | Issue 2 | e14723