
Page 58 - Human Environment Interface (4)
P. 58
Epigenetics of the Placenta
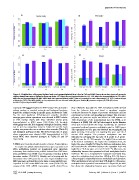
Figure 5. Distributions of hypomethylated and non-hypomethylated MspI sites in CVS and MBC tissues in various types of genomic
regions based on custom Agilent microarray data. CVO: MspI sites not hypomethylated in CVS. CVH: MspI sites hypomethylated in CVS. MBO:
MspI sites not hypomethylated in MBC. MBH: MspI sites hypomethylated in MBC. Data are presented for each chromosome (13, 18, 21) and each type
of MspI site (CVO, CVH, MBO, MBH), as the proportion that are located inside (A) gene bodies (B) promoter regions (C) CGIs (D) exons.
doi:10.1371/journal.pone.0014723.g005
expressed AND hypermethylated in MBC versus CVS, we found a these Affymetrix data with the DNA methylation profile derived
striking overlap in enriched networks and biological functions, from the Infinium data and found a significant negative
despite the minimal overlap in specific genes. As shown in Table correlation between the degree of promoter methylation and the
S5, the most significant IPA-designated networks identified expression level of the corresponding gene (Figure 8A). For these
amongst genes whose expressions were elevated in MBC relative purposes, the promoter region was defined as 1500 upstream to
to CVS overlap closely with those identified among genes 1500 downstream of the transcriptional start site (TSS), as in
hypomethylated in MBC versus CVS (Table S1). Similarly Rakyan et al (2008) [34]. All CpG sites targeted by the Illumina
overlapping were the IPA-designated biological functions, which array were located within this range. Specifically, we estimated
can be seen by comparison between Tables S2 and S6. Such expression levels and promoter methylation rate for 13,847 genes.
overlap was present but not so obvious when networks (Table S7) The expression level of a gene was obtained by averaging the log
and biological pathways (Table S8) derived from lists of genes signal intensity of the probe sets targeting that gene over the 8
whose expressions were elevated AND hypomethylated in CVS normal CVS samples. The promoter methylation rate was
versus MBC were observed (compare to Tables S3 and S4 estimated by averaging the log ratio of B probe to A probe–
respectively). log(B/A)–over the 12 CVS samples. The log(B/A) is an indicator
of the level of methylation: the higher the methylation level, the
T-DMRs are Correlated with Levels of Gene Transcription higher the value of log(B/A). Using the Infinium methylation data,
To explore the global relationship between gene expression and we found that the correlation between the expression level and
log(B/A) is 20.35 (p value of t test,2.2610216). Moreover, the
DNA methylation patterns we downloaded gene expression relationship between the expression level and methylation level is
microarray data obtained using mRNA derived from CVS tissue nonlinear. We ran a nonparametric regression and found that,
[33] and MBCs from NCBI Gene Expression Omnibus (GEO) when the methylation level is less than 50% (log B/A,0), there is
(accession number GSE14771). Notably, and in keeping with the a linear negative relationship between methylation and expression.
observation that CVS genomes are more hypomethylated than When methylation level is greater than 50% (logB/A.0) however,
MBC genomes, we found there to be twice as many mRNAs over- methylation and expression is uncorrelated. In Figure 8A, the solid
expressed in CVS versus MBC than vice versa (Table S9). We line shows the relationship between gene expression levels and
compared the CVS mRNA transcription profile derived from
PLoS ONE | www.plosone.org 10 February 2011 | Volume 6 | Issue 2 | e14723