
Page 211 - Applied Statistics with R
P. 211
11.2. INTERACTIONS 211
## 2 379 5754.2 1 1822.3 120.03 < 2.2e-16 ***
## ---
## Signif. codes: 0 '***' 0.001 '**' 0.01 '*' 0.05 '.' 0.1 ' ' 1
We can take a closer look at the coefficients of our fitted interaction model.
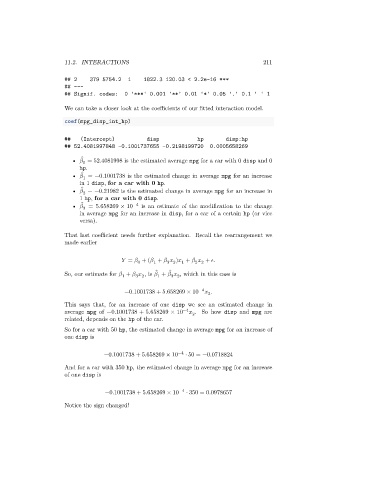
coef(mpg_disp_int_hp)
## (Intercept) disp hp disp:hp
## 52.4081997848 -0.1001737655 -0.2198199720 0.0005658269
̂
• = 52.4081998 is the estimated average mpg for a car with 0 disp and 0
0
hp.
̂
• = −0.1001738 is the estimated change in average mpg for an increase
1
in 1 disp, for a car with 0 hp.
̂
• = −0.21982 is the estimated change in average mpg for an increase in
2
1 hp, for a car with 0 disp.
̂
• = 5.658269 × 10 −4 is an estimate of the modification to the change
3
in average mpg for an increase in disp, for a car of a certain hp (or vice
versa).
That last coefficient needs further explanation. Recall the rearrangement we
made earlier
= + ( + ) + + .
2 2
1
1
0
3 2
̂
̂
So, our estimate for + , is + , which in this case is
3 2
3 2
1
1
−4
−0.1001738 + 5.658269 × 10 .
2
This says that, for an increase of one disp we see an estimated change in
−4
average mpg of −0.1001738 + 5.658269 × 10 . So how disp and mpg are
2
related, depends on the hp of the car.
So for a car with 50 hp, the estimated change in average mpg for an increase of
one disp is
−0.1001738 + 5.658269 × 10 −4 ⋅ 50 = −0.0718824
And for a car with 350 hp, the estimated change in average mpg for an increase
of one disp is
−0.1001738 + 5.658269 × 10 −4 ⋅ 350 = 0.0978657
Notice the sign changed!