
Page 366 - Applied Statistics with R
P. 366
366 CHAPTER 15. COLLINEARITY
## y x1 x2 x3
## 1 170.7135 93.70958 76.00483 494.4385
## 2 152.9106 74.35302 75.22376 452.6011
## 3 152.7866 83.63128 64.98396 430.1984
## 4 170.6306 86.32863 79.24241 492.6269
## 5 152.3320 84.04268 66.66613 437.7499
## 6 151.3155 78.93875 70.52757 442.9878
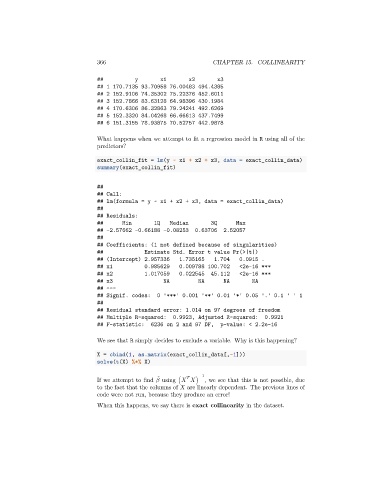
What happens when we attempt to fit a regression model in R using all of the
predictors?
exact_collin_fit = lm(y ~ x1 + x2 + x3, data = exact_collin_data)
summary(exact_collin_fit)
##
## Call:
## lm(formula = y ~ x1 + x2 + x3, data = exact_collin_data)
##
## Residuals:
## Min 1Q Median 3Q Max
## -2.57662 -0.66188 -0.08253 0.63706 2.52057
##
## Coefficients: (1 not defined because of singularities)
## Estimate Std. Error t value Pr(>|t|)
## (Intercept) 2.957336 1.735165 1.704 0.0915 .
## x1 0.985629 0.009788 100.702 <2e-16 ***
## x2 1.017059 0.022545 45.112 <2e-16 ***
## x3 NA NA NA NA
## ---
## Signif. codes: 0 '***' 0.001 '**' 0.01 '*' 0.05 '.' 0.1 ' ' 1
##
## Residual standard error: 1.014 on 97 degrees of freedom
## Multiple R-squared: 0.9923, Adjusted R-squared: 0.9921
## F-statistic: 6236 on 2 and 97 DF, p-value: < 2.2e-16
We see that R simply decides to exclude a variable. Why is this happening?
X = cbind(1, as.matrix(exact_collin_data[,-1]))
solve(t(X) %*% X)
−1
̂
If we attempt to find using ( ) , we see that this is not possible, due
to the fact that the columns of are linearly dependent. The previous lines of
code were not run, because they produce an error!
When this happens, we say there is exact collinearity in the dataset.