
Page 367 - Applied Statistics with R
P. 367
15.1. EXACT COLLINEARITY 367
As a result of this issue, R essentially chose to fit the model y ~ x1 + x2.
However notice that two other models would accomplish exactly the same fit.
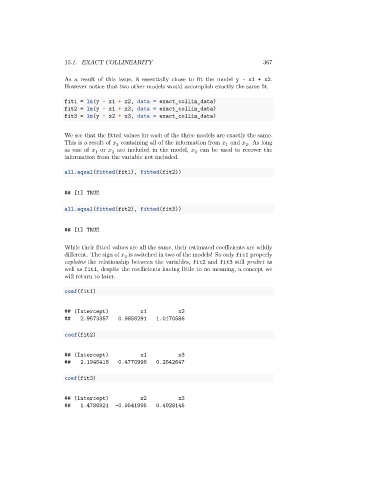
fit1 = lm(y ~ x1 + x2, data = exact_collin_data)
fit2 = lm(y ~ x1 + x3, data = exact_collin_data)
fit3 = lm(y ~ x2 + x3, data = exact_collin_data)
We see that the fitted values for each of the three models are exactly the same.
This is a result of containing all of the information from and . As long
3
1
2
as one of or are included in the model, can be used to recover the
3
1
2
information from the variable not included.
all.equal(fitted(fit1), fitted(fit2))
## [1] TRUE
all.equal(fitted(fit2), fitted(fit3))
## [1] TRUE
While their fitted values are all the same, their estimated coefficients are wildly
different. The sign of is switched in two of the models! So only fit1 properly
2
explains the relationship between the variables, fit2 and fit3 still predict as
well as fit1, despite the coefficients having little to no meaning, a concept we
will return to later.
coef(fit1)
## (Intercept) x1 x2
## 2.9573357 0.9856291 1.0170586
coef(fit2)
## (Intercept) x1 x3
## 2.1945418 0.4770998 0.2542647
coef(fit3)
## (Intercept) x2 x3
## 1.4788921 -0.9541995 0.4928145