


Page 82 - Applied Statistics with R
P. 82
82                 CHAPTER 5. PROBABILITY AND STATISTICS IN R


                                 c(mean(x_bars), mu)


                                 ## [1] 10.00008 10.00000


                                 c(var(x_bars), mu / sample_size)


                                 ## [1] 0.1989732 0.2000000


                                 c(sd(x_bars), sqrt(mu) / sqrt(sample_size))


                                 ## [1] 0.4460641 0.4472136


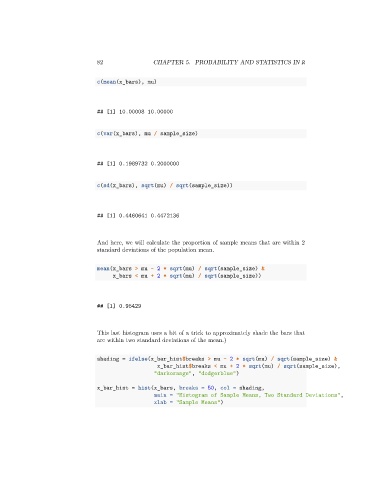
                                 And here, we will calculate the proportion of sample means that are within 2
                                 standard deviations of the population mean.


                                 mean(x_bars > mu - 2 * sqrt(mu) / sqrt(sample_size) &
                                      x_bars < mu + 2 * sqrt(mu) / sqrt(sample_size))


                                 ## [1] 0.95429


                                 This last histogram uses a bit of a trick to approximately shade the bars that
                                 are within two standard deviations of the mean.)

                                 shading = ifelse(x_bar_hist$breaks > mu - 2 * sqrt(mu) / sqrt(sample_size) &
                                                     x_bar_hist$breaks < mu + 2 * sqrt(mu) / sqrt(sample_size),
                                                    "darkorange", "dodgerblue")

                                 x_bar_hist = hist(x_bars, breaks = 50, col = shading,
                                                    main = "Histogram of Sample Means, Two Standard Deviations",
                                                    xlab = "Sample Means")

