Page 83 - Applied Statistics with R
P. 83

5.3. SIMULATION                                                    83


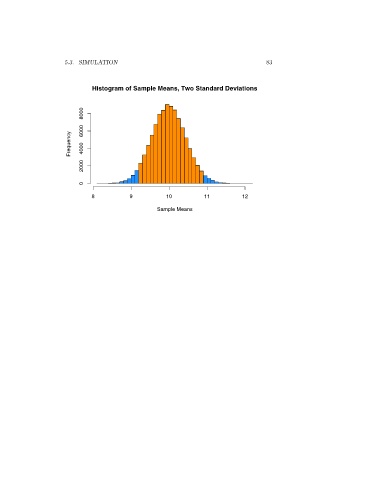
                               Histogram of Sample Means, Two Standard Deviations


                             8000


                             6000
                        Frequency  4000


                             2000


                             0
                               8            9           10           11          12

                                                     Sample Means
   78   79   80   81   82   83   84   85   86   87   88