
Page 81 - Applied Statistics with R
P. 81
5.3. SIMULATION 81
̄
→ ( , 2 ) .
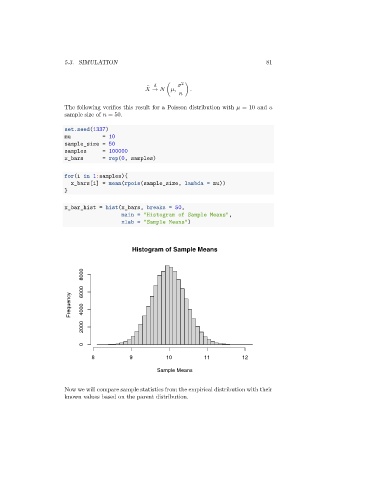
The following verifies this result for a Poisson distribution with = 10 and a
sample size of = 50.
set.seed(1337)
mu = 10
sample_size = 50
samples = 100000
x_bars = rep(0, samples)
for(i in 1:samples){
x_bars[i] = mean(rpois(sample_size, lambda = mu))
}
x_bar_hist = hist(x_bars, breaks = 50,
main = "Histogram of Sample Means",
xlab = "Sample Means")
Histogram of Sample Means
8000
Frequency 6000 4000
2000
0
8 9 10 11 12
Sample Means
Now we will compare sample statistics from the empirical distribution with their
known values based on the parent distribution.