Page 16 - ANC20-Proceedings-Presentations-Full
P. 16

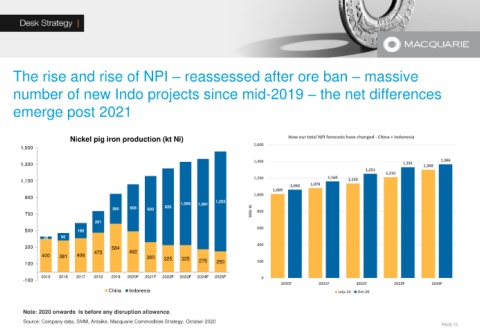
The rise and rise of NPI – reassessed after ore ban – massive

     number of new Indo projects since mid-2019 – the net differences


     emerge post 2021


                        Nickel pig iron production (kt Ni)                                     How our total NPI forecasts have changed - China + Indonesia
                                                                                   1,600
        1,500
                                                                                   1,400                                            1,331       1,366
        1,300                                                                                                                              1,300
                                                                                                                        1,251
                                                                                                                              1,210
                                                                                   1,200                    1,160  1,135
        1,100
                                                                                               1,060  1,079
                                                                                          1,009
                                                                                   1,000
         900
                                                            1,006  1,091  1,205
                                     360   568   800   926                           800
         700                                                                       '000t Ni
                                261
                                                                                     600
         500              185
               28    90
                                                                                     400
         300                         584
                                475        492
               400  381   408                    360  325   325
         100                                                      275  250           200

              2015  2016  2017  2018  2019  2020F  2021F  2022F  2023F  2024F  2025F  0
         -100
                                                                                            2020F        2021F       2022F       2023F       2024F
                                    China  Indonesia                                                           July-19  Oct-20


        Note: 2020 onwards  is before any disruption allowance.
        Source: Company data, SMM, Antaike, Macquarie Commodities Strategy, October 2020
                                                                                                                                                PAGE 15
   11   12   13   14   15   16   17   18   19   20   21