
Page 208 - Jurnal Pendidikan Tingkatan Enam 2019 - Jilid 3
P. 208
Perubahan Paradigma Pemikiran Ke Arah Pendidikan Berkualiti
teaching and learning session, the majority of students mistakenly choosing the wrong
method. There are also students who have chosen the right method, however, leaving
behind important working that enables them to score marks. In order to help them, a study
was conducted on them and the analysis found that they were still weak on this topic. An in-
depth analysis of the preceding studies will be described in more detail in the next section.
5.2.2 Interview Analysis
In addition, through the interviews conducted with the students, it can be concluded that
the majority of the students stated that they felt that they chose wrong method and unable
to distinguish which method they should choose. The majority of students also noted that
there are many steps to keep in mind and to understand in order to work out solutions to
first order linear differential equations. There are also some students said that they are
scared and worried when thinking about Mathematics.
5.2.3 Document Analysis
The pre-test conducted on students were able to assess their understanding and ability
to solve first order linear differential equations. Students were given three questions to
comple in 30 minutes. Once the assessment has been implemented, the students' answer
scripts are marked, and the analysis and scores for the study are shown in Table 5.1.
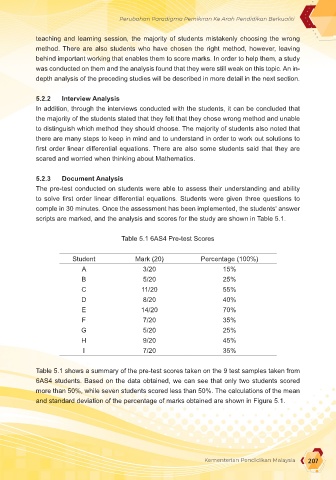
Table 5.1 6AS4 Pre-test Scores
Student Mark (20) Percentage (100%)
A 3/20 15%
B 5/20 25%
C 11/20 55%
D 8/20 40%
E 14/20 70%
F 7/20 35%
G 5/20 25%
H 9/20 45%
I 7/20 35%
Table 5.1 shows a summary of the pre-test scores taken on the 9 test samples taken from
6AS4 students. Based on the data obtained, we can see that only two students scored
more than 50%, while seven students scored less than 50%. The calculations of the mean
and standard deviation of the percentage of marks obtained are shown in Figure 5.1.
Kementerian Pendidikan Malaysia 207