
Page 209 - Jurnal Pendidikan Tingkatan Enam 2019 - Jilid 3
P. 209
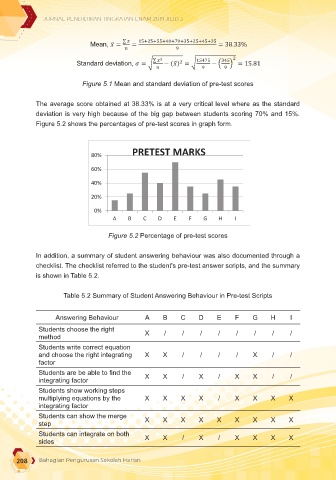
Table 5.1 6AS4 Pre-test Scores

                                         Table 5.1 6AS4 Pre-test Scores
                                                       Percentage (100%)
                     Student
                                      Mark (20)

                                        3/20

                                                              15%
                        A
                          Student
                                                             Percentage (100%)
                                           Mark (20)
                                                              25%
                        B
                                        5/20


                                                                   15%
                             A
                                              3/20
                        C
                                        11/20
                                                              55%
                                                                   25%
                                              5/20
                             B


                        D
                                        8/20
                                                              40%
                                             11/20
                                                                   55%
                             C

                                                              70%
                        E

                                        14/20
                                              8/20
                                                                   40%
                             D
                                                              35%
                                        7/20
                        F


                             E
                                             14/20
                                                                   70%
                        G
                                                              25%
                                        5/20
                             F
                                                                   35%

                                              7/20

                                                              45%
                                        9/20
                        H
                             G
                                              5/20
                                                                   25%


                        I
                                                              35%
                                        7/20
                                              9/20
                                                                   45%
                             H


                                              7/20
                              I
                                                                   35%
       Table 5.1 shows a summary of the pre-test scores taken on the 9 test samples taken from

       6AS4 students. Based on the data obtained, we can see that only two students scored more
            Table 5.1 shows a summary of the pre-test scores taken on the 9 test samples taken from
       than 50%, while seven students scored less than 50%. The calculations of the mean and
            6AS4 students. Based on the data obtained, we can see that only two students scored more
       standard deviation of the percentage of marks obtained are shown in Figure 5.1.
            than 50%, while seven students scored less than 50%. The calculations of the mean and

            standard deviation of the percentage of marks obtained are shown in Figure 5.1.
              JURNAL PENDIDIKAN TINGKATAN ENAM 2019 JILID 3

                                ∑       15+25+55+40+70+35+25+45+35
                              ̅
                       Mean,      =  =                       = 38.33%
                                                9
                                      ∑       15+25+55+40+70+35+25+45+35
                            Mean,      =  =  2                   2 = 38.33%
                                   ̅

                                                  2
                   Standard deviation,      = √ ∑       − (    ) = √ 9 15475  − ( 345 ) = 15.81
                                                 ̅
                                                        9      9
                                                                       2
                                               ∑      2  2  15475  345 ) = 15.81
                        Standard deviation,      = √        − (    ) = √  9  − (  9
                                                      ̅
                        Figure 5.1 Mean and standard deviation of pre-test scores
                          Figure 5.1 Mean and standard deviation of pre-test scores
                             Figure 5.1 Mean and standard deviation of pre-test scores
       The average score obtained at 38.33% is at a very critical level where as the standard

            The average score obtained at 38.33% is at a very critical level where as the standard
       deviation is very high because of the big gap between students scoring 70% and 15%.
            The average score obtained at 38.33% is at a very critical level where as the standard
            deviation is very high because of the big gap between students scoring 70% and 15%.
       Figure 5.2 shows the percentages of pre-test scores in graph form.
            deviation is very high because of the big gap between students scoring 70% and 15%.
            Figure 5.2 shows the percentages of pre-test scores in graph form.

            Figure 5.2 shows the percentages of pre-test scores in graph form.
                                         PRETEST MARKS
                            80%
                            60%   80%         PRETEST MARKS
                            40%   60%

                            20%   40%

                             0%   20%  B    C   D    E    F   G    H   I
                                   A
                                   0%   A    B   C    D    E   F   G    H    I
                                  Figure 5.2 Percentage of pre-test scores
                                Figure 5.2 Percentage of pre-test scores
                                     Figure 5.2 Percentage of pre-test scores
            In addition, a summary of student answering behaviour was also documented through a
            checklist. The checklist referred to the student's pre-test answer scripts, and the summary
            is shown in Table 5.2.


                    Table 5.2 Summary of Student Answering Behaviour in Pre-test Scripts

                  Answering Behaviour        A    B    C     D    E     F    G    H     I
             Students choose the right       X    /     /    /    /     /    /     /    /
             method
             Students write correct equation
             and choose the right integrating   X  X    /    /    /     /    X     /    /
             factor
             Students are be able to find the   X  X    /    X    /     X    X     /    /
             integrating factor
             Students show working steps
             multiplying equations by the    X    X    X     X    /     X    X    X     X
             integrating factor
             Students can show the merge     X    X    X     X    X     X    X    X     X
             step
             Students can integrate on both   X   X     /    X    /     X    X    X     X
             sides
      208    Bahagian Pengurusan Sekolah Harian