Page 216 - Jurnal Pendidikan Tingkatan Enam 2019 - Jilid 3
P. 216

Perubahan Paradigma Pemikiran Ke Arah Pendidikan Berkualiti

            equivalent to the questions raised in the pre-test. After the post-test, the student answer

            scripts are marked, and analyzed and the summary scores for the post-test are shown in
            Table 5.7.

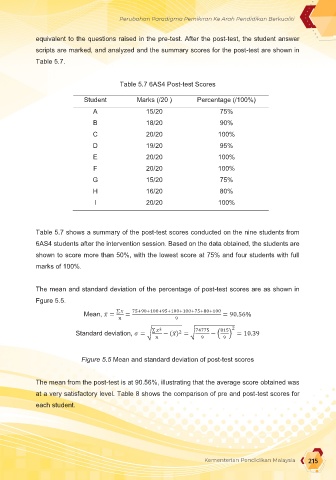
                                     Table 5.7 6AS4 Post-test Scores

                          Student         Marks (/20 )      Percentage (/100%)

                             A               15/20                 75%

                             B               18/20                 90%

                             C               20/20                100%

                             D               19/20                 95%

                             E               20/20                100%

                             F               20/20                100%

                             G               15/20                 75%

                             H               16/20                 80%

                             I               20/20                100%


            Table 5.7 shows a summary of the post-test scores conducted on the nine students from
            6AS4 students after the intervention session. Based on the data obtained, the students are
            shown to score more than 50%, with the lowest score at 75% and four students with full
            marks of 100%.

            The mean and standard deviation of the percentage of post-test scores are as shown in

            Fgure 5.5.
                                    ∑       75+90+100+95+100+100+75+80+100
                                 ̅
                          Mean,      =  =                           = 90.56%
                                                      9
                                               ∑      2     74775  815  2
                                                       2
                        Standard deviation,      = √  − (    ) = √  − (  ) = 10.39
                                                      ̅
                                                             9      9

                         Figure 5.5 Mean and standard deviation of post-test scores

            The mean from the post-test is at 90.56%, illustrating that the average score obtained was
            at a very satisfactory level. Table 8 shows the comparison of pre and post-test scores for
            each student.


                                                              Kementerian Pendidikan Malaysia  215
   211   212   213   214   215   216   217   218   219   220