
Page 217 - Jurnal Pendidikan Tingkatan Enam 2019 - Jilid 3
P. 217
JURNAL PENDIDIKAN TINGKATAN ENAM 2019 JILID 3
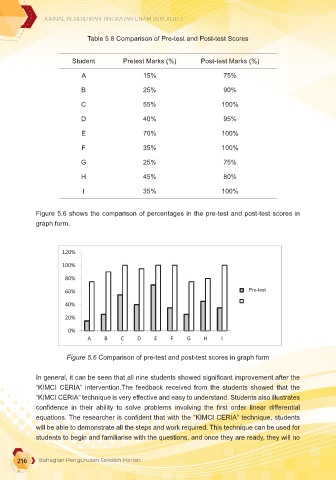
Table 5.8 Comparison of Pre-test and Post-test Scores
Student Pretest Marks (%) Post-test Marks (%)
A 15% 75%
Table 5.8 Comparison of Pre-test and Post-test Scores
B 25% 90%
Student Pretest Marks (%) Post-test Marks (%)
55%
100%
C 15% 75%
A
40%
D B 25% 90% 95%
E 55% 100%
C
70%
100%
D 40% 95%
F 35% 100%
E 70% 100%
75%
25%
G 35% 100%
F
H G 25% 75% 80%
45%
H 45% 80%
35%
I
100%
I 35% 100%
Figure 5.6 shows the comparison of percentages in the pre-test and post-test scores in
Figure 5.6 shows the comparison of percentages in the pre-test and post-test scores in
graph form.
graph form.
120%
100%
80%
60% PRAUJIAN
Pre-test
40% PASCAUJIAN
20% Post-test
0%
A B C D E F G H I
Figure 5.6 Comparison of pre-test and post-test scores in graph form
Figure 5.6 Comparison of pre-test and post-test scores in graph form
In general, it can be seen that all nine students showed significant improvement after the
In general, it can be seen that all nine students showed significant improvement after the
“KIMCI CERIA” intervention.The feedback received from the students showed that the
“KIMCI CERIA” intervention.The feedback received from the students showed that the
“KIMCI CERIA” technique is very effective and easy to understand. Students also illustrates
“KIMCI CERIA” technique is very effective and easy to understand. Students also illustrates
confidence in their ability to solve problems involving the first order linear differential
confidence in their ability to solve problems involving the first order linear differential
equations. The researcher is confident that with the “KIMCI CERIA” technique, students
equations. The researcher is confident that with the “KIMCI CERIA” technique, students will
will be able to demonstrate all the steps and work required. This technique can be used for
students to begin and familiarise with the questions, and once they are ready, they will no
be able to demonstrate all the steps and work required. This technique can be used for
students to begin and familiarise with the questions, and once they are ready, they will no
216 longer need to draw a table and write FeMCI again. All they have to do is just present the
Bahagian Pengurusan Sekolah Harian
working steps without a table as guide.