
Page 54 - Jurnal Pendidikan Tingkatan Enam 2019 - Jilid 3
P. 54
Perubahan Paradigma Pemikiran Ke Arah Pendidikan Berkualiti
Table 5.6 Data interpretation using ‘AS’
TREND T TIDY X 2 = S
or
ITEM I =TIDY x 1 TIDY + Link ‘TIDY AS’
= A
DATA D (Analysis)
YEAR Y (Synthesis)
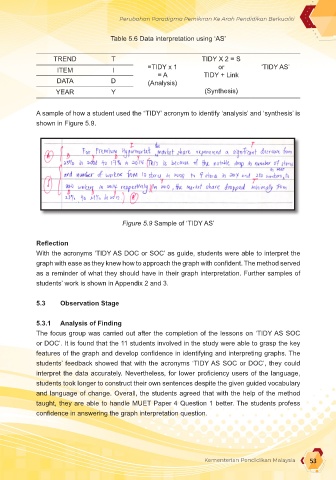
A sample of how a student used the “TIDY’ acronym to identify ‘analysis’ and ‘synthesis’ is
shown in Figure 5.9.
Figure 5.9 Sample of ‘TIDY AS’
Reflection
With the acronyms ‘TIDY AS DOC or SOC’ as guide, students were able to interpret the
graph with ease as they knew how to approach the graph with confident. The method served
as a reminder of what they should have in their graph interpretation. Further samples of
students’ work is shown in Appendix 2 and 3.
5.3 Observation Stage
5.3.1 Analysis of Finding
The focus group was carried out after the completion of the lessons on ‘TIDY AS SOC
or DOC’. It is found that the 11 students involved in the study were able to grasp the key
features of the graph and develop confidence in identifying and interpreting graphs. The
students’ feedback showed that with the acronyms ‘TIDY AS SOC or DOC’, they could
interpret the data accurately. Nevertheless, for lower proficiency users of the language,
students took longer to construct their own sentences despite the given guided vocabulary
and language of change. Overall, the students agreed that with the help of the method
taught, they are able to handle MUET Paper 4 Question 1 better. The students profess
confidence in answering the graph interpretation question.
Kementerian Pendidikan Malaysia 53