Page 10 - Modul A+1 Matematik Tingkatan 5
P. 10

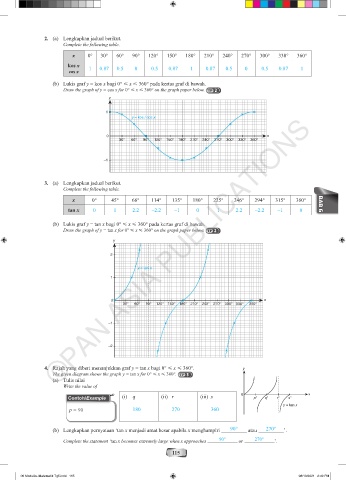
2.  (a)  Lengkapkan jadual berikut.
                         Complete the following table.
                            x     0°   30°   60°   90°   120°   150°   180°   210°   240°   270°   300°   330°   360°
                           kos x   1   0.87  0.5    0    –0.5   –0.87   –1    –0.87  –0.5    0      0.5   0.87    1
                           cos x

                     (b)  Lukis graf y = kos x bagi 0°  x  360° pada kertas graf di bawah.
                         Draw the graph of y = cos x for 0°  x  360° on the graph paper below.  TP  2
                                          y

                                         1
                                                   y = kos / cos x
                       ©PAN ASIA PUBLICATIONS


                                         0                                                            x
                                              30°  60°  90°  120°  150°  180°  210°  240°  270°  300°  330°  360°


                                        –1


                  3.  (a)  Lengkapkan jadual berikut.
                         Complete the following table.
                            x       0°     45°     66°    114°    135°    180°   225°    246°    294°    315°    360°    BAB 6

                           tan x    0       1      2.2    –2.2     –1      0       1      2.2    –2.2     –1      0

                     (b)  Lukis graf y = tan x bagi 0°  x  360° pada kertas graf di bawah.
                         Draw the graph of y = tan x for 0°  x  360° on the graph paper below.  TP  2
                                            y


                                           2

                                                     y = tan x
                                           1


                                           0                                                         x
                                               30°  60°  90°  120°  150° 180° 210°  240°  270° 300° 330°  360°


                                          –1


                                          –2


                  4.  Rajah yang diberi menunjukkan graf y = tan x bagi 0°  x  360°.       y
                     The given diagram shows the graph y = tan x for 0°  x  360°.  TP  3
                     (a)  Tulis nilai
                         Write the value of

                           Contoh/Example      (i)  q         (ii)  r        (iii)  s       0    p°  q°  r°   s°     x
                                                                                                            y = tan x
                           p = 90                  180            270            360


                     (b)  Lengkapkan pernyataan ‘tan x menjadi amat besar apabila x menghampiri   90°   atau   270°  ’.

                         Complete the statement ‘tan x becomes extremely large when x approaches   90°   or   270°  ’.

                                                                  115


         06 ModulA+ Matematik Tg5.indd   115                                                                      08/10/2021   2:49 PM
   5   6   7   8   9   10   11   12   13   14   15