Page 57 - Microsoft Word - Bogra-01-Community-11
P. 57

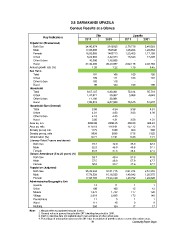
3.8 SARIAKANDI UPAZILA
       Census Results at a Glance

              Key Indicators                 Zila                      Upazila

Population (Enumerated)                2011         2001         2011           2001
    Both Sex
    Male                               34,00,874     3013035     2,70,719       2,40,083
    Female                             17,08,806     1547341     1,35,266       1,22,884
    Urban                              16,92,068     1465715     1,35,453       1,17,199
    Other Urban                                      2,42,373
    Rural                               6,24,082     1,46,695      18,543         17,320
                                           46,306   26,23,987              -              -
Annual growth rate (%)
Sex Ratio                              27,30,486           1.22  2,52,176       2,22,763
                                              1.20                    1.19           0.45
    Total
    Urban                                    101 106                   100 105
    Other Urban                              109 111                   103 104
    Rural                                    102 118
Household                                                                  --
    Total                                     99 104                   100 105
    Urban
    Other Urban                        8,67,137     6,88,361     75,614         55,719
    Rural                              1,47,921       50,367      5,069          4,049
Household Size (General)                              30,091             -              -
    Total                                11,198
    Urban                              7,08,018     6,07,903     70,545         51,670
    Other Urban
    Rural                                   3.88         4.34       3.58           4.31
Area sq. km.                                4.01         4.63       3.63           4.28
Area sq. mile                               4.10         4.55
Density per sq. km.                         3.85         4.31            -              -
Density per sq. mile                   2898.68      2898.25         3.58           4.31
Urbanization (%)                       1119.18      1119.01      408.50         408.45
Literacy Rate (7 years and above)          1173         1040     157.72         157.70
    Both Sex                               3039         2693         663            588
    Male                                  19.71        12.91       1716           1522
    Female                                                          6.85           7.21
School Attendance (5 to 24 years) (%)
    Both Sex                                 49.4 42.9           36.9 32.3
    Male                                     52.9 48.0           40.6 37.1
    Female                                   45.9 37.5           33.4 27.3
Population (Adjusted)
    Both Sex                                 53.7 43.4           52.8 42.8
    Male                                     57.5 46.9           57.9 47.7
    Female                                   50.0 39.7           47.6 37.7
Administrative/Geographic Unit
    Upazila                            35,39,294    31,51,715    2,81,274       2,51,203
    Union                              17,78,529    16,18,555    1,40,542       1,28,575
    Mauza                              17,60,765    15,33,160    1,40,732       1,22,628
    Village
    Paurashava                             12           11                11
    Ward                                 108          108               12 12
    Mahalla                            1,672        1,782              117 120
                                       2,618        2,695              173 146

                                           11            5                11
                                         111            48                99
                                         360          154               17 17

Note:  1. Mauza refers to populated mauzas in 2011.
       2. General refers to general household in 2011 dwelling household in 2001.
       3. Dash (-) denotes data not available due to non-existence of other urban area.
       4. Percentage of urbanization decreased in 2011 due to exclusion of growth centers or some other urban areas.

                                                                     39 Community Report: Bogra
   52   53   54   55   56   57   58   59   60   61   62