
Page 28 - Georgetown Retail Merchandising Plan 11.7.16 - FINAL
P. 28
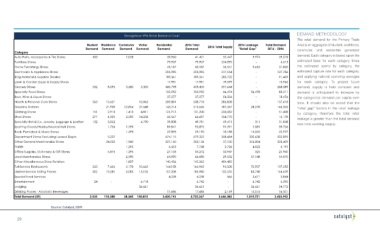
Georgetown PTA Retail Demand Chart DEMAND METHODOLOGY
The retail demand for the Primary Trade
Student Workforce Commuter Visitor Residential 2016 Total 2016 Leakage Total Demand Area is an aggregate of student, workforce,
Demand Demand Demand Demand Demand Demand 2016 Total Supply "Retail Gap" 2016 - 2046 commuter, and residential generated
Category
Auto Parts, Accessories & Tire Stores 433 1,028 39,960 41,421 31,447 9,974 29,518 demand. Each category is based upon the
Furniture Stores 79,907 79,907 224,593 - 6,015 estimated base for each category times
Home Furnishings Stores 45,187 45,187 35,531 9,655 31,820 the estimated spend by category, the
Electronics & Appliance Stores 205,985 205,985 217,554 - 127,786 estimated capture rate for each category,
Bldg Material & Supplies Dealers 189,361 189,361 283,732 - 91,459 and applying national spending averages
Lawn & Garden Equip & Supply Stores 17,981 17,981 19,599 - 10,966 for each category. To project future
Grocery Stores 532 8,095 3,680 5,300 460,798 478,405 597,644 - 268,089 demand, supply is held constant and
Specialty Food Stores 102,952 102,952 46,474 56,478 83,211 demand is anticipated to increase by
Beer, Wine & Liquor Stores 37,277 37,277 54,336 - 18,476 the categorical demand per capita over
Health & Personal Care Stores 353 15,621 12,863 209,881 238,718 285,838 - 137,618 time. It should also be noted that the
Gasoline Stations 21,930 12,854 37,648 143,214 215,645 187,367 28,278 146,326 “retail gap” factors in the retail leakage
Clothing Stores 151 2,913 1,413 4,811 121,913 131,200 235,082 - 51,408
by category, therefore the total retail
Shoe Stores 277 4,005 2,590 14,258 45,567 66,697 154,770 - 15,178
leakage is greater than the total demand
Specialty Retail (i.e. Jewelry, Luggage & Leather Goods Stores)132 3,052 6,790 39,808 49,781 49,471 311 31,848 less total existing supply.
Sporting Goods/Hobby/Musical Instr Stores 1,736 1,295 89,841 92,872 91,291 1,581 59,726
Book, Periodical & Music Stores 1,295 27,895 29,190 15,158 14,032 22,977
Department Stores Excluding Leased Depts. 5,207 674,115 679,322 358,684 320,638 532,895
Other General Merchandise Stores 24,032 1,942 327,160 353,134 37,130 316,004 323,409
Florists 1,295 6,453 7,748 3,726 4,022 6,191
Office Supplies, Stationery & Gift Stores 5,875 1,295 27,103 34,272 33,947 325 21,960
Used Merchandise Stores 2,590 64,090 66,680 29,532 37,148 54,070
Other Miscellaneous Store Retailers 1,807 140,456 142,262 454,482 - -
Full-Service Restaurants 333 7,634 2,178 10,662 144,158 164,965 94,028 70,937 127,255
Limited-Service Eating Places 302 10,281 3,085 15,105 157,208 185,980 102,232 83,748 144,639
Special Food Services 4,238 4,238 566 3,671 3,844
Entertainment 24 - 6,718 6,742 - 6,742 6,395
Lodging 36,661 36,661 - 36,661 34,772
Drinking Places - Alcoholic Beverages 17,686 17,686 2,169 15,516 16,101
Total Demand (SF) 2,535 110,380 38,345 150,815 3,420,193 3,722,267 3,646,383 1,015,721 2,403,952
Source: Catalyst, ESRI
28