
Page 46 - Georgetown Retail Merchandising Plan 11.7.16 - FINAL
P. 46
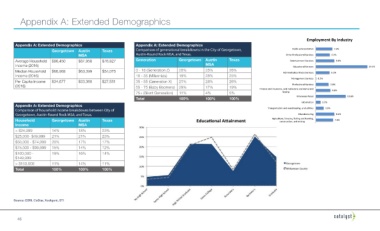
Appendix A: Extended Demographics


                                                                                                                                                                    Employment By Industry                 Employment
         Appendix A: Extended Demographics                               Appendix A: Extended Demographics                                                                                                 Industry
                            Georgetown     Austin      Texas             Comparison of generational breakdowns in the City of Georgetown,                    Public administra@on   7.5%
                                           MSA                           Austin-Round Rock MSA, and Texas.                                               Other Professional Services   6.3%
         Average Household  $86,450        $87,958     $76,927           Generation             Georgetown  Austin         Texas                           Entertainment Services   8.4%
         Income (2016)                                                                                        MSA                                             Educa@onal Services                    23.4%
         Median Household   $66,968        $63,399     $54,075           0 - 18 (Generation Z)  20%           25%          26%                         Administra@ce Waste Services   6.2%
         Income (2016)                                                   18 - 35 (Millennials)  19%           28%          25%
                                                                                                                                                            Management Services   0.2%
         Per Capita Income   $34,677       $33,360     $27,581           35 - 55 (Generation X)  21%          28%          26%
                                                                                                                                                            Professional Services
         (2016)                                                          55 - 75 (Baby Boomers)  29%          17%          19%              Finance and insurance, and real estate and rental and   5.8%
                                                                         75+ (Silent Generation)  11%         4%           5%                          leasing                   6.6%
                                                                                                                                                                Wholesale Retail         13.6%
                                                                         Total                  100%          100%         100%
                                                                                                                                                                  Informa@on   2.2%
         Appendix A: Extended Demographics
         Comparison of household income breakdowns between City of                                                                               Transporta@on and warehousing, and u@li@es   3.6%
         Georgetown, Austin-Round Rock MSA, and Texas.                                                                                                           Manufacturing     8.4%
         Household          Georgetown  Austin         Texas                                                                                       Agriculture, forestry, fishing and hun@ng,   7.8%
                                                                                                                                                     construc@on, and mining
         Income                            MSA
         < $24,999          14%            18%         23%
         $25,000- $49,999   21%            21%         23%
         $50,000 - $74,999  20%            17%         17%
         $75,000 - $99,999  15%            14%         12%
         $100,000 -         19%            16%         14%
         $149,999
         > $150,000         11%            14%         11%
         Total              100%           100%        100%


        Source: ESRI, CoStar, Xceligent, STI


          46