
Page 48 - Georgetown Retail Merchandising Plan 11.7.16 - FINAL
P. 48
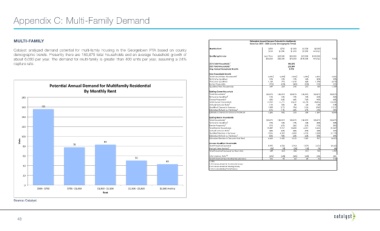
Appendix C: Multi-Family Demand
MULTI-FAMILY Estimated Annual Demand Potential for Multifamily
Based on 2015 - 2020 County Demographic Trends
Catalyst analyzed demand potential for multi-family housing in the Georgetown PTA based on county Monthly Rent $500 $1,000 $1,000 $1,500 And Up
$2,000
$750
$2,000
$750
$1,500
demographic trends. Presently there are 180,875 total households and an average household growth of Qualifying Income Less Than $35,000 $50,000 $75,000 $100,000
about 6,000 per year. The demand for multi-family is greater than 400 units per year, assuming a 24% $35,000 $50,000 $75,000 $100,000 And Up Total
capture rate. 2016 Total Households 1 180,875
2021 Total Households 1 210,849
Avg. Annual Household Growth 5,995
New Household Growth
Total Annual New Households 1 5,995 5,995 5,995 5,995 5,995 5,995
% Income Qualified 19% 12% 17% 14% 30% 92%
# Income Qualified 1,139 719 1,019 839 1,798 5,515
Poten+al Annual Demand for Mul+family Residen+al Renter Propensity 57% 45% 34% 25% 10% 1,709
31%
Qualified New Households
346
324
180
210
649
By Monthly Rent Existing Owner Household
Total Households 1 180,875 180,875 180,875 180,875 180,875 180,875
180 % Income Qualified 2 19% 12% 17% 14% 30% 92%
Owner Propensity 2 42% 54% 64% 74% 90% 63%
Total Owner Households 14,434 11,721 19,679 18,739 48,836 113,409
Annual Turnover Rate 2 11% 10% 5% 6% 13% 10%
160 156 Qualified Owners in Turnover 1588 1172 984 1124 6349 11217
Estimated % Rent vs. Purchase 3 81% 71% 34% 27% 25% 39%
Estimated Owners in Turnover that Rent 1,286 832 335 304 1,587 4,344
140 Existing Renter Households
Total Households 1 180,875 180,875 180,875 180,875 180,875 180,875
% Income Qualified 2 19% 12% 17% 14% 30% 92%
Renter Propensity 2 57% 45% 34% 25% 10% 29%
120
Total Renter Households 19,589 9,767 10,455 6,331 5,426 51,567
Annual Turnover Rate 2 40% 45% 33% 49% 44% 41%
Qualified Renters in Turnover 7,836 4,395 3,450 3,102 2,388 21,170
85%
44%
65%
69%
78%
100 Estimated % Rent vs. Purchase 3 6,660 3,428 2,243 1,365 38% 14,603
Estimated Renters in Turnover that Rent
907
Units 83 Income Qualified Households
80 78 Total Potential Demand 8,595 4,584 2,924 1,878 2,674 20,656
Percent New Renters 3 8% 7% 12% 11% 7% 8%
Total Potential Demand for New Units 649 324 346 210 180 1,709
60 City Capture Rate 3,4 24% 24% 24% 24% 24% 24%
50 Total Potential New Multifamily Demand 156 78 83 50 43 410
43 1. ESRI
2. US Census American Community Survey
40 3. US Census American Housing Survey
4. US Census Building Permits Survey
20
0
$500 - $750 $750 - $1,000 $1,000 - $1,500 $1,500 - $2,000 $2,000 And Up
Rent
Source: Catalyst
48