Page 47 - Georgetown Retail Merchandising Plan 11.7.16 - FINAL
P. 47

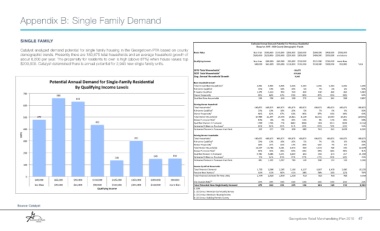
Appendix B: Single Family Demand


            SINGLE FAMILY
                                                                                                                                      Estimated Annual Demand Potential For Purchase Residential
                                                                                                                                         Based on 2015 - 2020 County Demographic Trends
            Catalyst analyzed demand potential for single family housing in the Georgetown PTA based on county
                                                                                                                                        less than $100,000 $150,000 $200,000 $250,000
                                                                                                                                                                                     $500,000
            demographic trends. Presently there are 180,875 total households and an average household growth of   Home Value           $100,000 $150,000 $200,000 $250,000 $300,000  $300,000  $400,000  and above
                                                                                                                                                                              $500,000
                                                                                                                                                                       $400,000
            about 6,000 per year. The propensity for residents to own is high (above 87%) when house values top   Qualifying Income     less than  $40,000  $65,000  $90,000 $110,000  $125,000  $150,000  more than
            $200,000. Catalyst determined there is annual potential for 2,943 new single family units.                                  $40,000  $65,000  $90,000 $110,000 $125,000  $150,000  $200,000  200,000  Total
                                                                                                        2016 Total Households 1                              180,875
                                                                                                        2021 Total Households 1                              210,849
                                                                                                        Avg. Annual Household Growth                          5,995
                           Poten4al Annual Demand for Single-Family Residen4al                          New Household Growth
                                         By Qualifying Income Levels                                    Total Annual New Households 1    5,995  5,995  5,995  5,995  5,995  5,995  5,995  5,995  5,995
                                                                                                                                          23%
                                                                                                                                                19%
                                                                                                                                                                                 6%
                                                                                                                                                                                                 92%
                                                                                                                                                                                        6%
                                                                                                        % Income Qualified
                                                                                                                                                      16%
                                                                                                                                                                          7%
                                                                                                                                                            10%
                                                                                                                                                                  5%
                                                                                                        # Income Qualified               1,379  1,139  959  599   300     420    360   360      5,515
             700
                               660                                                                      Owner Propensity                  43%   62%   67%   93%   90%     87%   93%    94%       69%
                                         631                                                            Qualified New Households          593   706   643   558   270     365    335   338      3,807
             600                                                                                        Existing Owner Household
                                                                                                        Total Households 1              180,875  180,875  180,875  180,875  180,875  180,875  180,875  180,875  180,875
                                                                                                        % Income Qualified 2              23%   19%   16%   10%   5%      7%     6%     6%       92%
                                                                                                        Owner Propensity 2                43%   62%   67%   93%   90%     87%   93%    94%       64%
             500     479                                                                                Total Owner Households           17,889  21,307  19,390  16,821  8,139  11,015  10,093  10,201  114,856
                                                                                                        Annual Turnover Rate 2            10%    8%   4%    10%   13%     9%    12%    19%       10%
                                                    435                                                 Qualified Owners in Turnover      1789  1705  776  1682  1058     991   1211   1938     11150
                                                                                                        Estimated % Rent vs. Purchase 3   18%   28%   42%   51%  65%      95%   78%    84%       55%
             400                                                                                        Estimated Owners in Turnover that Rent  322  477  326  858  688   942    945  1,628     6,185
             Units                                                      301                             Existing Renter Households
                                                                                                                 1
             300                                                                                        Total Households  2             180,875  180,875  180,875  180,875  180,875  180,875  180,875  180,875  180,875
                                                                                                                                                      16%
                                                                                                                                          23%
                                                                                                                                                19%
                                                                                                                                                            10%
                                                                                                                                                                                        6%
                                                                                                                                                                                                 92%
                                                                                                                                                                                 6%
                                                                                                                                                                  5%
                                                                                                                                                                          7%
                                                                                                        % Income Qualified
                                                                                                        Renter Propensity 2               56%   37%   32%   17%   10%     12%    7%     5%       29%
                                                                                                        Total Renter Households          23,297  12,716  9,261  3,075  904  1,519  760  543     52,074
                                                                                                        Annual Turnover Rate 2            42%   40%   35%   54%   29%     55%   28%    40%       41%
             200                                                                                        Qualified Renters in Turnover    9,785  5,086  3,241  1,660  262  836    213   217      21,300
                                                                                   149       152                       3
                                                              136                                       Estimated % Rent vs. Purchase      9%   26%   40%   47%  57%      67%   58%    60%       25%
                                                                                                        Estimated Renters in Turnover that Rent  881  1,322  1,297  780  149  560  123  130     5,243
             100
                                                                                                        Income Qualified Households
                                                                                                        Total Potential Demand           1,795  2,506  2,265  2,196  1,107  1,867  1,403  2,096  15,235
                                                                                                        Percent New Renters 3             82%   81%   86%   61%   38%     50%   33%    22%       59%
               0                                                                                        Total Potential Demand for New Units  1,474  2,029  1,939  1,338  419  925  458  468    9,050
                   $40,000    $65,000   $90,000   $110,000   $125,000   $150,000   $200,000   200,000
                                                                                                        City Capture Rate 3,4             33%   33%   33%   33%   33%     33%   33%    33%       33%
                   less than   $40,000   $65,000   $90,000   $110,000   $125,000   $150,000   more than   Total Potential New Singlefamily Demand  479  660  631  435  136  301  149   152      2,943
                                                     Qualifying Income                                  1. ESRI
                                                                                                        2. US Census American Community Survey
                                                                                                        3. US Census American Housing Survey
                                                                                                        4. US Census Building Permits Survey
          Source: Catalyst
                                                                                                                                                          Georgetown Retail Merchandising Plan 2016  47
   42   43   44   45   46   47   48   49   50   51   52