
Page 41 - 18-868 SEO PowerSuite Workflow_VPMGC
P. 41
SEO Workflow
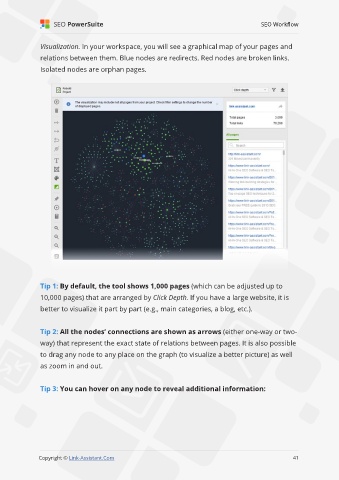
Visualization. In your workspace, you will see a graphical map of your pages and
relations between them. Blue nodes are redirects. Red nodes are broken links.
Isolated nodes are orphan pages.
Tip 1: By default, the tool shows 1,000 pages (which can be adjusted up to
10,000 pages) that are arranged by Click Depth. If you have a large website, it is
better to visualize it part by part (e.g., main categories, a blog, etc.).
Tip 2: All the nodes’ connections are shown as arrows (either one-way or two-
way) that represent the exact state of relations between pages. It is also possible
to drag any node to any place on the graph (to visualize a better picture) as well
as zoom in and out.
Tip 3: You can hover on any node to reveal additional information:
41
Copyright © Link-Assistant.Com 41