
Page 33 - Vol 7 No 3 July September 2017
P. 33
PESY: Print ISSN 2231-1394, Online ISSN 2278-795X Vol. 7 No 3
ANOVA
Source of
Variation SS df MS F P-value F crit
Between
Groups 85.68324 3 28.561 3.215 0.029 2.764
Within Groups 515.2361 58 8.883
Total 600.9194 61
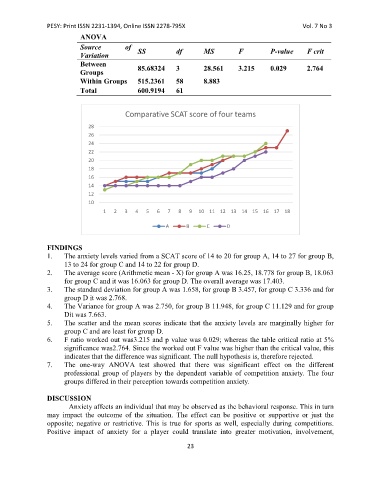
Comparative SCAT score of four teams
28
26
24
22
20
18
16
14
12
10
1 2 3 4 5 6 7 8 9 10 11 12 13 14 15 16 17 18
A B C D
FINDINGS
1. The anxiety levels varied from a SCAT score of 14 to 20 for group A, 14 to 27 for group B,
13 to 24 for group C and 14 to 22 for group D.
2. The average score (Arithmetic mean - X) for group A was 16.25, 18.778 for group B, 18.063
for group C and it was 16.063 for group D. The overall average was 17.403.
3. The standard deviation for group A was 1.658, for group B 3.457, for group C 3.336 and for
group D it was 2.768.
4. The Variance for group A was 2.750, for group B 11.948, for group C 11.129 and for group
Dit was 7.663.
5. The scatter and the mean scores indicate that the anxiety levels are marginally higher for
group C and are least for group D.
6. F ratio worked out was3.215 and p value was 0.029; whereas the table critical ratio at 5%
significance was2.764. Since the worked out F value was higher than the critical value, this
indicates that the difference was significant. The null hypothesis is, therefore rejected.
7. The one-way ANOVA test showed that there was significant effect on the different
professional group of players by the dependent variable of competition anxiety. The four
groups differed in their perception towards competition anxiety.
DISCUSSION
Anxiety affects an individual that may be observed as the behavioral response. This in turn
may impact the outcome of the situation. The effect can be positive or supportive or just the
opposite; negative or restrictive. This is true for sports as well, especially during competitions.
Positive impact of anxiety for a player could translate into greater motivation, involvement,
23