
Page 28 - Vol 7 No 3 July September 2017
P. 28
PESY: Print ISSN 2231-1394, Online ISSN 2278-795X Vol. 7 No 3
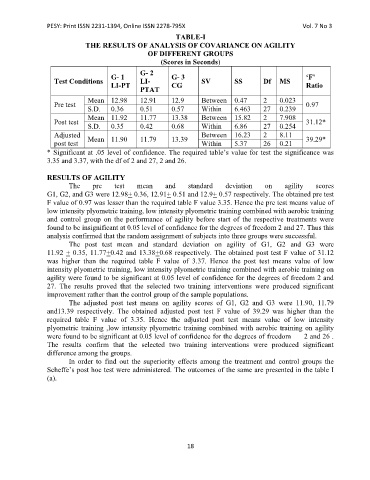
TABLE-I
THE RESULTS OF ANALYSIS OF COVARIANCE ON AGILITY
OF DIFFERENT GROUPS
(Scores in Seconds)
G- 2
G- 1 G- 3 ‘F’
Test Conditions LI- SV SS Df MS
LI-PT CG Ratio
PTAT
Mean 12.98 12.91 12.9 Between 0.47 2 0.023
Pre test 0.97
S.D. 0.36 0.51 0.57 Within 6.463 27 0.239
Mean 11.92 11.77 13.38 Between 15.82 2 7.908
Post test 31.12*
S.D. 0.35 0.42 0.68 Within 6.86 27 0.254
Adjusted Mean 11.90 11.79 13.39 Between 16.23 2 8.11 39.29*
post test Within 5.37 26 0.21
* Significant at .05 level of confidence. The required table’s value for test the significance was
3.35 and 3.37, with the df of 2 and 27, 2 and 26.
RESULTS OF AGILITY
The pre test mean and standard deviation on agility scores
G1, G2, and G3 were 12.98+ 0.36, 12.91+ 0.51 and 12.9+ 0.57 respectively. The obtained pre test
F value of 0.97 was lesser than the required table F value 3.35. Hence the pre test means value of
low intensity plyometric training, low intensity plyometric training combined with aerobic training
and control group on the performance of agility before start of the respective treatments were
found to be insignificant at 0.05 level of confidence for the degrees of freedom 2 and 27. Thus this
analysis confirmed that the random assignment of subjects into three groups were successful.
The post test mean and standard deviation on agility of G1, G2 and G3 were
11.92 + 0.35, 11.77+0.42 and 13.38+0.68 respectively. The obtained post test F value of 31.12
was higher than the required table F value of 3.37. Hence the post test means value of low
intensity plyometric training, low intensity plyometric training combined with aerobic training on
agility were found to be significant at 0.05 level of confidence for the degrees of freedom 2 and
27. The results proved that the selected two training interventions were produced significant
improvement rather than the control group of the sample populations.
The adjusted post test means on agility scores of G1, G2 and G3 were 11.90, 11.79
and13.39 respectively. The obtained adjusted post test F value of 39.29 was higher than the
required table F value of 3.35. Hence the adjusted post test means value of low intensity
plyometric training ,low intensity plyometric training combined with aerobic training on agility
were found to be significant at 0.05 level of confidence for the degrees of freedom 2 and 26 .
The results confirm that the selected two training interventions were produced significant
difference among the groups.
In order to find out the superiority effects among the treatment and control groups the
Scheffe’s post hoc test were administered. The outcomes of the same are presented in the table I
(a).
18