
Page 56 - TGfU & Mini Game Flip Book
P. 56
40 TGfU & MINI GAME
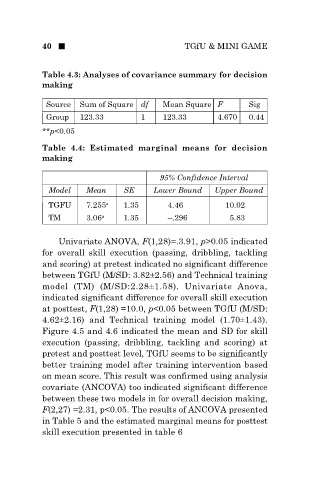
Table 4.3: Analyses of covariance summary for decision
making
Source Sum of Square df Mean Square F Sig
Group 123.33 1 123.33 4.670 0.44
**p<0.05
Table 4.4: Estimated marginal means for decision
making
95% Confidence Interval
Model Mean SE Lower Bound Upper Bound
TGFU 7.255 a 1.35 4.46 10.02
TM 3.06 a 1.35 –.296 5.83
Univariate ANOVA, F(1,28)=.3.91, p>0.05 indicated
for overall skill execution (passing, dribbling, tackling
and scoring) at pretest indicated no significant difference
between TGfU (M/SD: 3.82±2.56) and Technical training
model (TM) (M/SD:2.28±1.58). Univariate Anova,
indicated significant difference for overall skill execution
at posttest, F(1,28) =10.0, p<0.05 between TGfU (M/SD:
4.62±2.16) and Technical training model (1.70±1.43).
Figure 4.5 and 4.6 indicated the mean and SD for skill
execution (passing, dribbling, tackling and scoring) at
pretest and posttest level, TGfU seems to be significantly
better training model after training intervention based
on mean score. This result was confirmed using analysis
covariate (ANCOVA) too indicated significant difference
between these two models in for overall decision making,
F(2,27) =2.31, p<0.05. The results of ANCOVA presented
in Table 5 and the estimated marginal means for posttest
skill execution presented in table 6