
Page 58 - TGfU & Mini Game Flip Book
P. 58
42 TGfU & MINI GAME
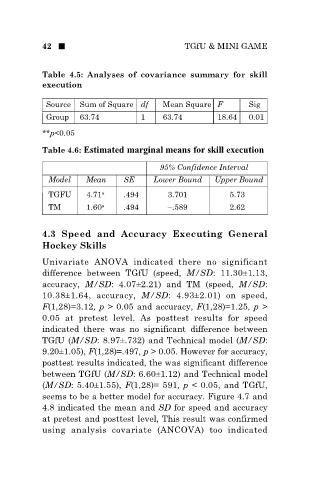
Table 4.5: Analyses of covariance summary for skill
execution
Source Sum of Square df Mean Square F Sig
Group 63.74 1 63.74 18.64 0.01
**p<0.05
Table 4.6: Estimated marginal means for skill execution
95% Confidence Interval
Model Mean SE Lower Bound Upper Bound
TGFU 4.71 a .494 3.701 5.73
TM 1.60 a .494 –.589 2.62
4.3 Speed and Accuracy Executing General
Hockey Skills
Univariate ANOVA indicated there no significant
difference between TGfU (speed, M/SD: 11.30±1.13,
accuracy, M/SD: 4.07±2.21) and TM (speed, M/SD:
10.38±1.64, accuracy, M/SD: 4.93±2.01) on speed,
F(1,28)=3.12, p > 0.05 and accuracy, F(1,28)=1.25, p >
0.05 at pretest level. As posttest results for speed
indicated there was no significant difference between
TGfU (M/SD: 8.97±.732) and Technical model (M/SD:
9.20±1.05), F(1,28)=.497, p > 0.05. However for accuracy,
posttest results indicated, the was significant difference
between TGfU (M/SD: 6.60±1.12) and Technical model
(M/SD: 5.40±1.55), F(1,28)= 591, p < 0.05, and TGfU,
seems to be a better model for accuracy. Figure 4.7 and
4.8 indicated the mean and SD for speed and accuracy
at pretest and posttest level, This result was confirmed
using analysis covariate (ANCOVA) too indicated