
Page 60 - TGfU & Mini Game Flip Book
P. 60
44 TGfU & MINI GAME
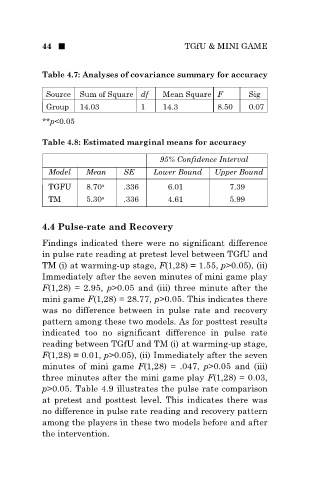
Table 4.7: Analyses of covariance summary for accuracy
Source Sum of Square df Mean Square F Sig
Group 14.03 1 14.3 8.50 0.07
**p<0.05
Table 4.8: Estimated marginal means for accuracy
95% Confidence Interval
Model Mean SE Lower Bound Upper Bound
TGFU 8.70 a .336 6.01 7.39
TM 5.30 a .336 4.61 5.99
4.4 Pulse-rate and Recovery
Findings indicated there were no significant difference
in pulse rate reading at pretest level between TGfU and
TM (i) at warming-up stage, F(1,28) = 1.55, p>0.05), (ii)
Immediately after the seven minutes of mini game play
F(1,28) = 2.95, p>0.05 and (iii) three minute after the
mini game F(1,28) = 28.77, p>0.05. This indicates there
was no difference between in pulse rate and recovery
pattern among these two models. As for posttest results
indicated too no significant difference in pulse rate
reading between TGfU and TM (i) at warming-up stage,
F(1,28) = 0.01, p>0.05), (ii) Immediately after the seven
minutes of mini game F(1,28) = .047, p>0.05 and (iii)
three minutes after the mini game play F(1,28) = 0.03,
p>0.05. Table 4.9 illustrates the pulse rate comparison
at pretest and posttest level. This indicates there was
no difference in pulse rate reading and recovery pattern
among the players in these two models before and after
the intervention.