
Page 62 - TGfU & Mini Game Flip Book
P. 62
46 TGfU & MINI GAME
4.5 Cardiovascular Fitness
Pretest results indicated there were no significant
deference between TGfU and TM in cardiovascular
fitness using bleep test (MSFT), F(1,28) = 2.83, p>0.05.
As for posttest results there was significant difference
between TGfU (M/SD:9.27±1.22 and Technical model (M/
SD:7.42±.79) in term of cardiovascular fitness, F(1,28) =
22.45, p<0.05. Table 4.10 illustrates the results mean
and SD converted V0 max calculations as suggested by
2
Legar and Lambert (1982). As the Figure 4.9 and 4.10
indicated the mean and SD cardiovascular fitness using
V0 max calculation at pretest and posttest level, TGfU
2
seems to be significantly better training model for
cardiovascular fitness after training intervention based
on mean score. This result was confirmed using analysis
covariate (ANCOVA) too indicated significant difference
between these two models in for cardiovascular fitness
(V0 max), F(2,27) =2.31, p<0.05. The results of ANCOVA
2
presented in Table 4.11 and the estimated marginal
means for posttest cardiovascular fitness presented in
Table 4.12
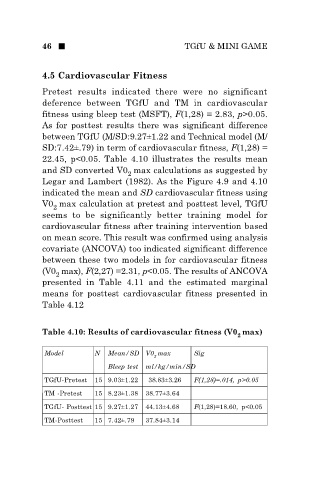
Table 4.10: Results of cardiovascular fitness (V0 max)
2
Model N Mean/SD V0 max Sig
2
Bleep test ml/kg/min/SD
TGfU-Pretest 15 9.03±1.22 38.83±3.26 F(1,28)=.014, p>0.05
TM -Pretest 15 8.23±1.38 38.77±3.64
TGfU- Posttest 15 9.27±1.27 44.13±4.68 F(1,28)=18.60, p<0.05
TM-Posttest 15 7.42±.79 37.84±3.14