
Page 164 - Math Smart - 7
P. 164
CHAPTER 7.1
In this chapter
Pupils should be able to:
• decide which data
would be relevant to an
enquiry and collect and
organise the data
• design and use a data
collection sheet or
questionnaire for a Data is often collected by observing, questioning or measuring. Data is often
simple survey organised in tables and represented using graphs or charts. In other words, data is
information that helps to inform people to make decisions.
We can use a data collection sheet or a questionnaire to help us collect
Information about a product or an event.
Data collection sheet
Tally marks are often used to record numerical information on the data collection
sheet. Tally marks are used to keep count by drawing marks. Every fifth mark is
drawn across the previous four marks so that you can easily count groups of five.
#
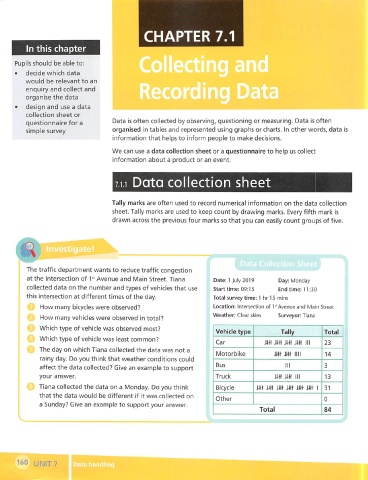
The traffic department wants to reduce traffic congestion
at the intersection of 1" Avenue and Main Street. Tiana Date: 1 July 2019 Day: Monday
collected data on the number and types of vehicles that use Start time: 09:15 End time: 11:30
this intersection at different times of the day. Total survey time: 1 hr 15 mins
How many bicycles were observed? Location: Intersection of 1 "Avenue and Main Street
Weather: Clear skies Surveyor: Tiana
How many vehicles were observed in total?
Which type of vehicle was observed most?
Vehicle type Tally Total
Which type of vehicle was least common?
Car im ifH ifH III 23
The day on which Tiana collected the data was not a
Motorbike mm iiii 14
rainy day. Do you think that weather conditions could
affect the data collected? Give an example to support Bus ill 3
your answer. Truck MM 13
III
Tiana collected the data on a Monday. Do you think Bicycle mm mmmmi 31
that the data would be different if it was collected on
Other 0
a Sunday? Give an example to support your answer.
Total 84
160 UNIT? Data handling
I