
Page 167 - Math Smart - 7
P. 167
CHAPTER 7.2
equencyHBiies In this chapter
Pupils should be able to:
for Grouped and • construct and use
frequency tables
Ungrouped Data to gather discrete
data, grouped where
appropriate in equal
class intervals
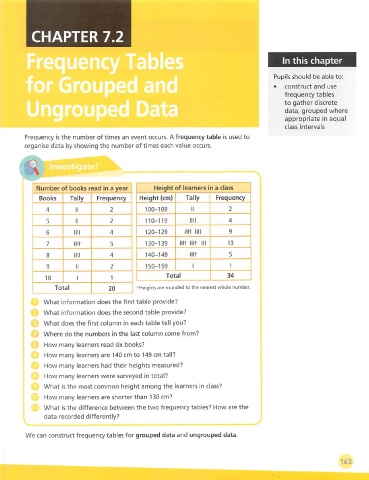
Frequency is the number of times an event occurs. A frequency table is used to
organise data by showing the number of times each value occurs.
Number of books read in a year Height of learners in a class
Books Tally Frequency Height (cm) Tally Frequency
4 II 2 100-109 II 2
5 II 2 110-119 nil 4
6 nil 4 120-129 m Mil 9
7 m 5 130-139 -mt m III 13
8 nil 4 140-149 m 5
9 n 2 150-159 1 1
Total 34
10 1
Total 20 ^Heights are rounded to the nearest whole number.
What information does the first table provide?
What information does the second table provide?
What does the first column in each table tell you?
Where do the numbers in the last column come from?
How many learners read six books?
How many learners are 140 cm to 149 cm tall?
How many learners had their heights measured?
How many learners were surveyed in total?
What is the most common height among the learners in class?
How many learners are shorter than 130 cm?
What is the difference between the two frequency tables? How are the
data recorded differently?
We can construct frequency tables for grouped data and ungrouped data.