
Page 169 - Math Smart - 7
P. 169
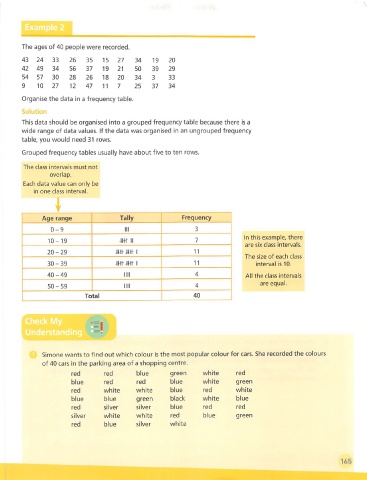
The ages of 40 people were recorded.

        43   24   33   26    35   15   27    34   19    20
        42   49   34   56    37   19   21    50   39    29
        54   57   30   28    26   18   20    34   3     33
        9    10   27   12    47   11   7     25   37    34

        Organise the data in a frequency table.
        Solution
        This data should be organised into a grouped frequency table because there is a
        wide range of data values. If the data was organised in an ungrouped frequency
        table, you would need 31 rows.
        Grouped frequency tables usually have about five to ten rows.


         The class intervals must not
                 overlap.
        Each data value can only be
            in one class interval.


               Age range                Tally               Frequency
                 0-9                     III                    3
                                                                                In this example, there
                                           II
                10-19                   m                       7
                                                                                are six class intervals.
                                             1
                20-29                 mm                        11
                                                                                The size of each class
                                             1
                30-39                 mm                        11                  interval is 10.
                40-49                    nil                    4                All the class inten/als
                                                                                     are equal.
                50-59                    nil                    4
                            Total                               40


         Check My

         Und
               m

               Simone wants to find out which colour is the most popular colour for cars. She recorded the colours
               of 40 cars in the parking area of a shopping centre.
                        red        red       blue       green      white     red
                        blue       red       red        blue       white      green
                        red        white     white      blue       red        white
                        blue       blue      green      black      white      blue
                        red       silver     silver     blue       red        red
                        silver     white     white      red        blue       green
                        red        blue      silver     white


                                                                                                               165