
Page 168 - Math Smart - 7
P. 168
7.2.1 Frequency tables for ungrouped
data
Ungrouped data is data that is not organised into groups. In other words, the
data are discrete. In an ungrouped data frequency table, data can be presented in
a list.
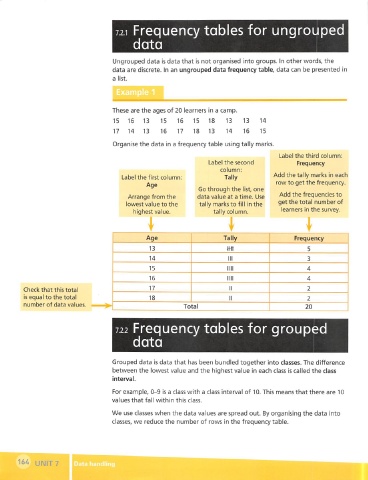
These are the ages of 20 learners in a camp.
15 16 13 15 16 15 18 13 13 14
17 14 13 16 17 18 13 14 16 15
Organise the data in a frequency table using tally marks.
Label the third column:
Label the second Frequency
column:
Add the tally marks in each
Label the first column: Tally
row to get the frequency.
Age
Go through the list, one
Add the frequencies to
Arrange from the data value at a time. Use
lowest value to the tally marks to fill in the get the total number of
highest value. tally column. learners in the survey.
Age Tally Frequency
13 m 5
14 III 3
15 nil 4
16 nil 4
Check that this total 17 n 2
is equal to the total 18 n 2
number of data values.
Total 20
7.2.2 Frequency tables for grouped
data
Grouped data is data that has been bundled together into classes. The difference
between the lowest value and the highest value in each class is called the class
interval.
For example, 0-9 is a class with a class interval of 10. This means that there are 10
values that fall within this class.
We use classes when the data values are spread out. By organising the data into
classes, we reduce the number of rows in the frequency table.
164 UNIT7f Data handling