
Page 263 - Math Smart - 7
P. 263
straight line distance-time graphs
A distance-time graph gives us information about a journey. It tells us the
distance from where the journey started, how long the journey took, or how fast
one travelled.
Example 5
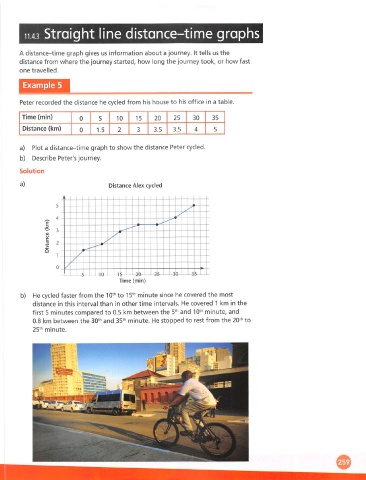
Peter recorded the distance he cycled from his house to his office in a table.
Time (min)
0 5 10 15 20 25 30 35
Distance (km) 3.5
0 1.5 2 3 3.5 4 5
a) Plot a distance-time graph to show the distance Peter cycled.
b) Describe Peter's journey.
Solution
a) Distance Alex cycled
-
/.
^40- -A 5... 1 S- •3 S-
Time (mtn)
b) He cycled faster from the 10"' to 15^^ minute since he covered the most
distance in this interval than in other time intervals. He covered 1 km in the
first 5 minutes compared to 0.5 km between the and 10"^ minute, and
0.8 km between the 30^^ and 35^^ minute. He stopped to rest from the 20^^ to
25**^ minute.