
Page 397 - Math Smart - 7
P. 397
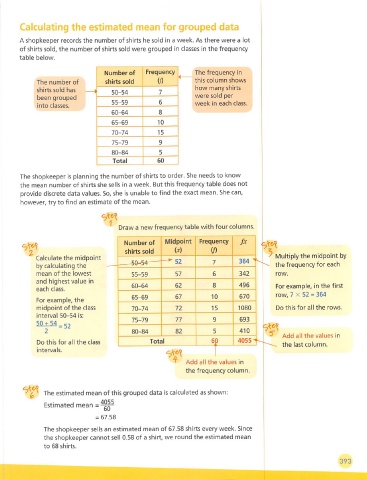
Calculating the estimated mean for grouped data

       A shopkeeper records the number of shirts he sold In a week. As there were a lot
       of shirts sold, the number of shirts sold were grouped in classes in the frequency
       table below.


                                   Number of    Frequency       The frequency in
             The number of         shirts sold      (/)         this column shows
                                                                how many shirts
             shirts sold has
                                     50-54          7
             been grouped                                       were sold per
                                     55-59          6           week in each class.
             into classes.
                                     60-64          8
                                     65-69          10
                                     70-74          15
                                     75-79          9
                                     80-84          5
                                      Total         60

       The shopkeeper is planning the number of shirts to order. She needs to know
       the mean number of shirts she sells in a week. But this frequency table does not
        provide discrete data values. So, she is unable to find the exact mean. She can,
        however, try to find an estimate of the mean.


                                    1
                                       Draw a new frequency table with four columns.
                                                       Midpoint   Frequency
                                         Number of                             fx
                                         shirts sold     (X)         if)                5 Multiply the midpoint by
             Calculate the midpoint
                                                      —^ 52           7       364 ^
             by calculating the                                                         -  the frequency for each
             mean of the lowest             55-59         57          6        342        row.
             and highest value in
                                           60-64          62          8        496        For example, in the first
             each class.
                                                                                          row, 7 X 52 = 364
                                            65-69         67         10        670
             For example, the
             midpoint of the class          70-74         72         15       1080        Do this for all the rows.
             interval 50-54 is:
                                            75-79         77          9        693
             50 + 54 _ ^2
                                            80-84         82          5        410
                                                                                             Add all the values in
             Do this for all the class            Total              60       4055-
                                                                                            the last column.
             intervals.
                                                                       I
                                                         '    Add all the values in
                                                             the frequency column.


               The estimated mean of this grouped data is calculated as shown:

               Estimated mean
                                = 67.58
               The shopkeeper sells an estimated mean of 67.58 shirts every week. Since
               the shopkeeper cannot sell 0.58 of a shirt, we round the estimated mean
               to 68 shirts.

                                                                                                               393