
Page 398 - Math Smart - 7
P. 398
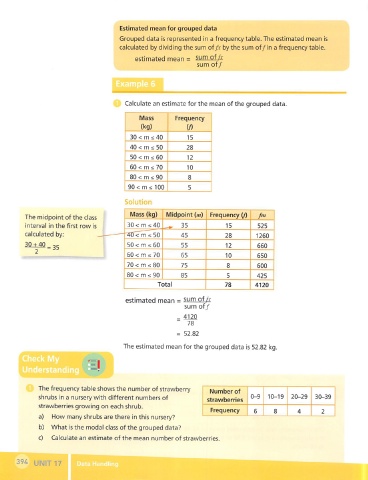
Estimated mean for grouped data

                                        Grouped data is represented in a frequency table. The estimated mean is
                                        calculated by dividing the sum of f.\ by the sum of/in a frequency table.
                                             estimated mean = sum of/v
                                                                 sum of/


                                         Calculate an estimate for the mean of the grouped data.


                                              Mass        Frequency
                                              (kg)           (/)

                                           30 < m s40        15
                                           40 < m £ 50       28
                                           50 < m £ 60       12
                                           60 < m £ 70       10
                                           80 < m £ 90        8
                                          90 < m £ 100        5

                                         Solutioii
                                           Mass (kg)   Midpoint (m) Frequency (/)   /m
         The midpoint of the class
         interval in the first row is     30 < m £ 40 ^                   15        525
                                                            35
         calculated by:                  '4(r<rrr£ 50      45             28        1260
         30 + 40                          50 < m £ 60       55            12        660
                = 35
            2
                                          60 < m £ 70      65             10        650
                                          70 < m £ 80      75             8         600
                                          80 < m £ 90      85             5         425
                                                    Total                 78       4120

                                          estimated mean = sum of/a-
                                                             sum of/
                                                          - 4120
                                                              78
                                                          = 52.82

                                         The estimated mean for the grouped data is 52.82 kg.


             The frequency table shows the number of strawberry
                                                                     Number of
             shrubs in a nursery with different numbers of                        0-9   10-19  20-29   30-39
                                                                    strawberries
             strawberries growing on each shrub.
                                                                     Frequency     6     8       4       2
             a)  How many shrubs are there in this nursery?
             b)  What is the modal class of the grouped data?
             c)  Calculate an estimate of the mean number of strawberries.


      394  UNIT 17