
Page 402 - Math Smart - 7
P. 402
Looking at all the measures, the most useful information is obtained by
combining the range and the median.
The median of Maths is and the range is from to
The median of English is and the range is from to
The median divides the scores almost in half. It is a better measure of central
tendency than the mean or the mode for this set of data.
This also shows that overall, the pupils performed better and more consistently
for Maths, than for English.
Spotlight
PM Uyout Formulis
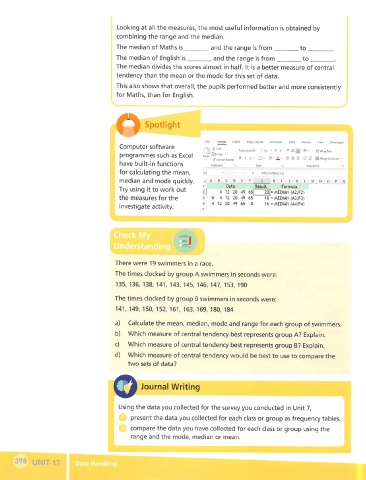
Computer software
A Cut
TietouchtlMS A* *■ ;^WrapTett
programmes such as Excel P*a« Qac<w • ^ ^ • 3- = -= IS IE S Megc & Ctnttt
FonnA Pjintw
have built-in functions Cii0l>o«pd f Aiignniciu
for calculating the mean, =MeD(AN(A2:F2)
median and mode quickly. G H M N
Data Result Formula
Try using it to work out 4 12 20 49 65[ M = MEDIAN (A2:F2)
the measures for the 0 4 12 20 49 65 16 = MEDIAN (A3:F3|
4 12 20 49 65 0 16 = MEDIAN (A4:F4)
Investigate activity.
There were 19 swimmers in a race.
The times clocked by group A swimmers in seconds were:
135, 136, 138, 141, 143, 145, 146, 147, 153, 190
The times clocked by group B swimmers in seconds were:
141, 149, 150, 152, 161, 163, 169, 180, 184
a) Calculate the mean, median, mode and range for each group of swimmers.
b) Which measure of central tendency best represents group A? Explain.
c) Which measure of central tendency best represents group B? Explain.
d) Which measure of central tendency would be best to use to compare the
two sets of data?
lO Journal Writing
L present the data you collected for each class or group as frequency tables.
Using the data you collected for the survey you conducted in Unit 7,
compare the data you have collected for each class or group using the
range and the mode, median or mean.
398 UNIT« Data Handling