Page 399 - Math Smart - 7
P. 399

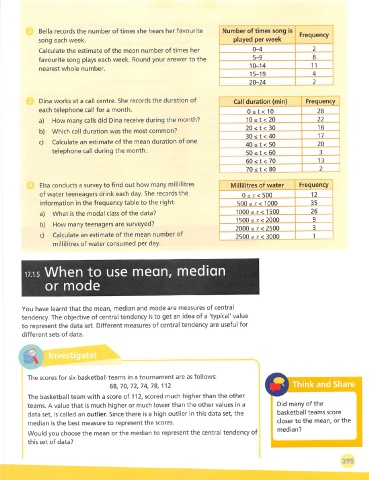
Bella records the number of times she hears her favourite  Number of times song is
                                                                                                  Frequency
             song each week.                                                played per week
              Calculate the estimate of the mean number of times her              0-4                 2
             favourite song plays each week. Round your answer to the              5-9                8
                                                                                  10-14              11
              nearest whole number.
                                                                                  15-19               4
                                                                                 20-24                2


              Dina works at a call centre. She records the duration of      Call duration (min)     Frequency
             each telephone call for a month.
                                                                                 0£t< 10               28
             a)  How many calls did Dina receive during the month?              10<t<20                22
                                                                                20£t<30                 18
              b)  Which call duration was the most common?
                                                                                30 £ t < 40             17
              c)  Calculate an estimate of the mean duration of one
                                                                                40 5 t < 50            20
                  telephone call during the month.
                                                                                50 £ t < 60             3
                                                                                60£t<70                 13
                                                                                70 s t < 80             2

              Elsa conducts a survey to find out how many millilitres       Millilitres of water  Frequency
              of water teeneagers drink each day. She records the              0 ^ .V < 500          12
              information in the frequency table to the right.               500 <.v< 1000           35

              a)  What is the modal class of the data?                       1000 <v< 1500           26
                                                                             1500 £ v < 2000          9
              b)  How many teenagers are surveyed?
                                                                             2000 s r < 2500          3
              c)  Calculate an estimate of the mean number of
                                                                             2500 £ A- < 3000         1
                  millilitres of water consumed per day.


         17.15 When to use mean, median

               or mode


        You have learnt that the mean, median and mode are measures of central
        tendency. The objective of central tendency is to get an idea of a 'typical' value
        to represent the data set. Different measures of central tendency are useful for
        different sets of data.


          The scores for six basketball teams in a tournament are as follows:
                                    68, 70, 72, 74, 78, 112                                      hink and Share
          The basketball team with a score of 112, scored much higher than the other
          teams. A value that is much higher or much lower than the other values in a      Did many of the
          data set, is called an outlier. Since there is a high outlier in this data set, the  basketball teams score
                                                                                          closer to the mean, or the
          median is the best measure to represent the scores.
                                                                                           median?
          Would you choose the mean or the median to represent the central tendency of
          this set of data?


                                                                                                               395
   394   395   396   397   398   399   400   401   402   403   404