
Page 437 - Math Smart - 7
P. 437
Help
Sheet
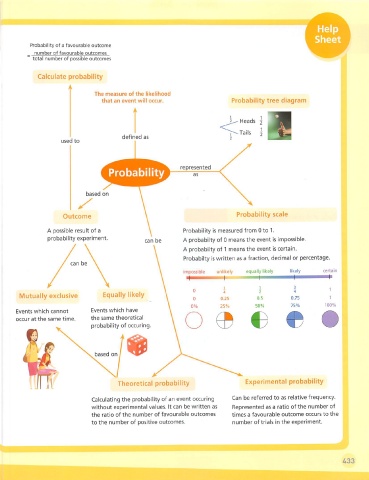
Probability of a favourable outcome
number of favourable outcomes
total
' number of possible outcomes
Calculate probability
The measure of the likelihood
that an event will occur. Probability tree diagram
Heads 2
defined as
used to
represented
Probability as
based on
Probability scale
Outcome
A possible result of a Probability is measured from 0 to 1.
probability experiment.
can be A probabilty of 0 means the event is impossible.
A probabilty of 1 means the event is certain.
Probabilty is written as a fraction, decimal or percentage.
can be
impossible unlikely equally likely likely certain ,u.
*
1 3 1
2 4
Mutually exclusive Equally likely
0.5 0.75 1
50% 75% 100%
Events which cannot Events which have
occur at the same time. the same theoretical
probability of occuring. 0 © e
based on
Theoretical probability Experimental probability
Calculating the probability of an event occuring Can be referred to as relative frequency.
without experimental values. It can be written as Represented as a ratio of the number of
the ratio of the number of favourable outcomes times a favourable outcome occurs to the
to the number of positive outcomes. number of trials in the experiment.
433