
Page 432 - Math Smart - 7
P. 432
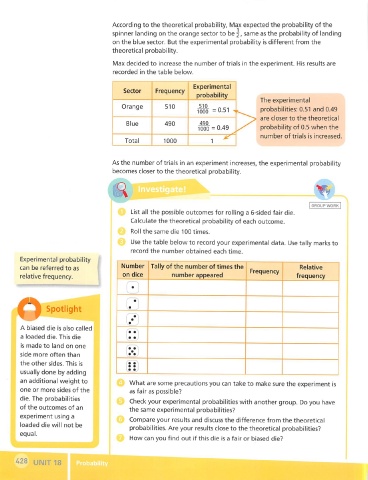
According to the theoretical probability, Max expected the probability of the
                                     spinner landing on the orange sector to be 2, same as the probability of landing
                                     on the blue sector. But the experimental probability is different from the
                                     theoretical probability.
                                      Max decided to increase the number of trials in the experiment. His results are
                                     recorded in the table below.

                                                                Experimental
                                         Sector    Frequency
                                                                 probability
                                                                                     The experimental
                                        Orange        510
                                                                 1000 =0.51          probabilities: 0.51 and 0.49
                                                                                     are closer to the theoretical
                                          Blue        490         490
                                                                 1000 = 0.49         probability of 0.5 when the
                                                                                     number of trials is increased.
                                         Total        1000           1


                                     As the number of trials in an experiment increases, the experimental probability
                                     becomes closer to the theoretical probability.


                                                                                                      GROUP WORK
                                           List all the possible outcomes for rolling a 6-sided fair die.
                                           Calculate the theoretical probability of each outcome.

                                           Roll the same die 100 times.
                                           Use the table below to record your experimental data. Use tally marks to
                                           record the number obtained each time.
       Experimental probability
       can be referred to as            Number Tally of the number of times the                   Relative
                                                                                  Frequency
       relative frequency.               on dice         number appeared                         frequency
                                          ' •

                                          i' "•
                                              i
                Spotlight
                                            •
                                              :
                                              ;

                                          : •
                                          ' •
        A biased die is also called
                                         '• •
                                              ''
                                          i
        a loaded die. This die            ' •
                                            •
        is made to land on one

                                          I  •
       side more often than
       the other sides. This is           f •
                                            •
                                          : •
        usually done by adding
       an additional weight to             What are some precautions you can take to make sure the experiment is
       one or more sides of the            as fair as possible?
       die. The probabilities
                                           Check your experimental probabilities with another group. Do you have
       of the outcomes of an
                                           the same experimental probabilities?
       experiment using a
                                           Compare your results and discuss the difference from the theoretical
       loaded die will not be
                                           probabilities. Are your results close to the theoretical probabilities?
       equal.
                                           How can you find out if this die is a fair or biased die?
      i28 UNIT 18