
Page 53 - Lecture Notes DCC3113
P. 53
The mean optimum bitumen content shall be determined by averaging five optimum bitumen
contents so determined as follows;
i. Peak of curve taken from the stability graph, % Bitumen Content = 4.90 %
ii. Flow equals to 3 mm from the flow graph, % Bitumen Content = 5.00 %
iii. Peak of curve taken from the bulk specific gravity graph, % Bitumen Content = 5.25 %
iv. VFB equals to 75% for wearing course and 70% for binder course from the VFB graph, %
Bitumen Content = 5.25 %
v. VIM equals to 4.0% for wearing course and 5.0% for binder course from the VIM graph, %
Bitumen Content = 5.25 %
Check
Table 3-8: Data comparison with JKR STANDARD SPECIFICATION FOR ROADWORKS
Specification
Parameter Result Remarks
(Binder Course, JKR 1988)
Stability 10 kN / 1000kg > 450 kg OK
Flow 3 mm > 2.0 mm OK
Stiffness - > 225 kg/mm -
VTM 4 % 3.0 – 7.0 % OK
VFB 75 % 65 – 80 % OK
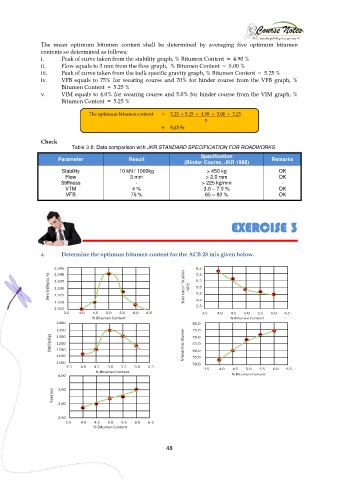
EXERCISE 3
a. Determine the optimum bitumen content for the ACB 28 mix given below.
48