
Page 50 - Lecture Notes DCC3113
P. 50
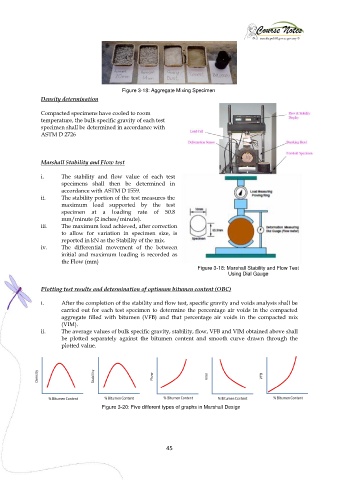
Figure 3-18: Aggregate Mixing Specimen
               Density determination

               Compacted specimens have cooled to room
               temperature, the bulk specific gravity of each test
               specimen shall be determined in accordance with
               ASTM D 2726


               Marshall Stability and Flow test

               i.      The  stability  and  flow  value  of  each  test
                       specimens  shall  then  be  determined  in
                       accordance with ASTM D 1559.
               ii.     The stability portion of the test measures the
                       maximum  load  supported  by  the  test
                       specimen  at  a  loading  rate  of  50.8
                       mm/minute (2 inches/minute).
               iii.    The maximum load achieved, after correction
                       to  allow  for  variation  in  specimen  size,  is
                       reported in kN as the Stability of the mix.
               iv.     The  differential  movement  of  the  between
                       initial  and  maximum  loading  is  recorded  as
                       the Flow (mm)
                                                                      Figure 3-18: Marshall Stability and Flow Test
                                                                                 Using Dial Gauge

               Plotting test results and determination of optimum bitumen content (OBC)

               i.      After the completion of the stability and flow test, specific gravity and voids analysis shall be
                       carried out for each test specimen to determine  the  percentage air voids in the  compacted
                       aggregate  filled  with  bitumen  (VFB)  and  that  percentage  air  voids  in  the  compacted  mix
                       (VIM).
               ii.     The average values of bulk specific gravity, stability, flow, VFB and VIM obtained above shall
                       be  plotted  separately  against  the  bitumen  content  and  smooth  curve  drawn  through  the
                       plotted value.


                                     Figure 3-20: Five different types of graphs in Marshall Design


                                                           45