
Page 51 - Lecture Notes DCC3113
P. 51
iii. The mean optimum bitumen content shall be determined by averaging five optimum
bitumen contents so determined as follows;
a) Peak of curve taken from the stability graph
b) Flow equals to 3 mm from the flow graph
c) Peak of curve taken from the bulk specific gravity graph
d) VFB equals to 75% for wearing course and 70% for binder course from the VFB graph
e) VIM equals to 4.0% for wearing course and 5.0% for binder course from the VIM graph.
Specification Parameter for AC JKR/SPJ/2008-S4
• The mixture shall be designed in accordance to the Standard Marshall Test Method.
• It shall conform to the following requirements :
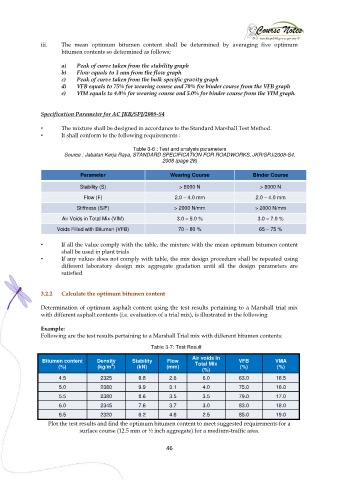
Table 3-6 : Test and analysis parameters
Source : Jabatan Kerja Raya, STANDARD SPECIFICATION FOR ROADWORKS, JKR/SPJ/2008-S4,
2008 (page 28)
Parameter Wearing Course Binder Course
Stability (S) > 8000 N > 8000 N
Flow (F) 2.0 – 4.0 mm 2.0 – 4.0 mm
Stiffness (S/F) > 2000 N/mm > 2000 N/mm
Air Voids in Total Mix (VIM) 3.0 – 5.0 % 3.0 – 7.0 %
Voids Filled with Bitumen (VFB) 70 – 80 % 65 – 75 %
• If all the value comply with the table, the mixture with the mean optimum bitumen content
shall be used in plant trials
• If any values does not comply with table, the mix design procedure shall be repeated using
different laboratory design mix aggregate gradation until all the design parameters are
satisfied
3.2.2 Calculate the optimum bitumen content
Determination of optimum asphalt content using the test results pertaining to a Marshall trial mix
with different asphalt contents (i.e. evaluation of a trial mix), is illustrated in the following
Example:
Following are the test results pertaining to a Marshall Trial mix with different bitumen contents:
Table 3-7: Test Result
Air voids In
Bitumen content Density Stability Flow Total Mix VFB VMA
3
(%) (kg/m ) (kN) (mm) (%) (%)
(%)
4.5 2325 9.8 2.6 6.0 63.0 16.5
5.0 2380 9.9 3.1 4.0 75.0 16.0
5.5 2380 8.6 3.5 3.5 79.0 17.0
6.0 2345 7.6 3.7 3.0 83.0 18.0
6.5 2320 6.2 4.6 2.5 85.0 19.0
Plot the test results and find the optimum bitumen content to meet suggested requirements for a
surface course (12.5 mm or ½ inch aggregate) for a medium-traffic area.
46