
Page 295 - fbkCardioDiabetes_2017
P. 295
Cardio Diabetes Medicine 2017 271
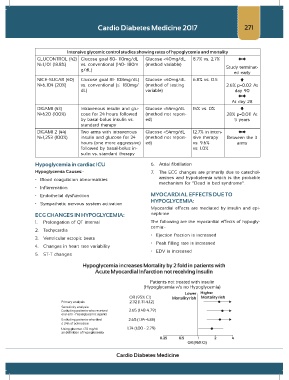
Intensive glycemic control studies showing rates of hypoglycemia and mortality
GLUCONTROL (42) Glucose goal 80- 110mg/dL Glucose <40mg/dL 8.7% vs. 2.7%
N=1,101 (18.8%) vs. conventional (140- 180m (method variable) Study terminat-
g/dL)
ed early
NICE-SUGAR (40) Glucose goal 81- 108mg/dL) Glucose <40mg/dL 6.8% vs. 0.5
N=6,104 (20%) vs. conventional (≤ 180mg/ (method of testing 2.6% p=0.02 At
dL) variable) day 90
At day 28
DIGAMI (43) Intravenous insulin and glu- Glucose <54mg/dL 15% vs. 0%
N=620 (100%) cose for 24 hours followed (method not report- 28% p=0.011 At
by basal-bolus insulin vs. ed) 5 years
standard therapy
DIGAMI 2 (44) Two arms with intravenous Glucose <54mg/dL 12.7% in inten-
N=1,253 (100%) insulin and glucose for 24 (method not report- sive therapy Between the 3
hours (one more aggressive) ed) vs. 9.6% arms
followed by basal-bolus in- vs. 1.0%
sulin vs. standard therapy
Hypoglycemia in cardiac ICU 6. Atrial fibrillation
Hypoglycemia Causes:- 7. The ECG changes are primarily due to catechol-
• Blood coagulation abnormalities amines and hypokalemia which is the probable
mechanism for “Dead in bed syndrome”.
• Inflammation
• Endothelial dysfunction MYOCARDIAL EFFECTS DUE TO
HYPOGLYCEMIA:
• Sympathetic nervous system activation
Myocardial effects are mediated by insulin and epi-
ECG CHANGES IN HYPOGLYCEMIA: nephrine
1. Prolongation of QT interval The following are the myocardial effects of hypogly-
cemia:-
2. Tachycardia
• Ejection fraction is increased
3. Ventricular ectopic beats
• Peak filling rate is increased
4. Changes in heart rate variability
• EDV is increased
5. ST-T changes
Cardio Diabetes Medicine