
Page 175 - 2018 Comprehensive Annual Financial Report - City of Winston-Salem
P. 175
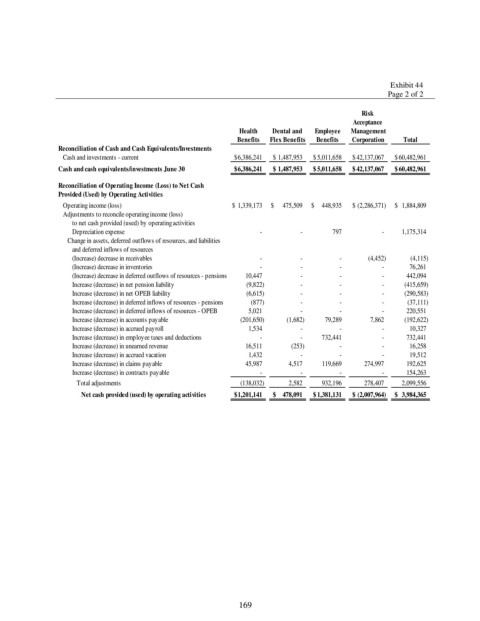
Exhibit 44
                                                                                                    Page 2 of 2

                                                                                             Risk
                                                                                           Acceptance
                                                              Health  Dental and   Employee  Management
                                                             Benefits  Flex Benefits  Benefits  Corporation  Total
                Reconciliation of Cash and Cash Equivalents/Investments
                 Cash and investments - current              $  6,386,241  $   1,487,953  $  5,011,658  $  42,137,067  $  60,482,961
                Cash and cash equivalents/investments June 30  $  6,386,241  $   1,487,953  $  5,011,658  $  42,137,067  $  60,482,961

                Reconciliation of Operating Income (Loss) to Net Cash
                Provided (Used) by Operating Activities
                 Operating income (loss)                    $   1,339,173  $       475,509  $       448,935  $   (2,286,371)  $    1,884,809
                 Adjustments to reconcile operating income (loss)
                   to net cash provided (used) by operating activities
                   Depreciation expense                                         -                      -                797                       -        1,175,314
                  Change in assets, deferred outflows of resources, and liabilities
                   and deferred inflows of resources
                   (Increase) decrease in receivables                           -                      -                     -              (4,452)              (4,115)
                   (Increase) decrease in inventories                           -                      -                     -                       -             76,261
                   (Increase) decrease in deferred outflows of resources - pensions           10,447                      -                     -                       -           442,094
                   Increase (decrease) in net pension liability            (9,822)                      -                     -                       -          (415,659)
                   Increase (decrease) in net OPEB liability            (6,615)                      -                     -                       -          (290,583)
                   Increase (decrease) in deferred inflows of resources - pensions               (877)                      -                     -                       -            (37,111)
                   Increase (decrease) in deferred inflows of resources - OPEB             5,021                      -                     -                       -           220,551
                   Increase (decrease) in accounts payable         (201,650)             (1,682)           79,289               7,862          (192,622)
                   Increase (decrease) in accrued payroll               1,534                      -                     -                       -             10,327
                   Increase (decrease) in employee taxes and deductions                     -                      -         732,441                       -           732,441
                   Increase (decrease) in unearned revenue            16,511                (253)                     -                       -             16,258
                   Increase (decrease) in accrued vacation              1,432                      -                     -                       -             19,512
                   Increase (decrease) in claims payable              45,987              4,517         119,669           274,997           192,625
                   Increase (decrease) in contracts payable                     -                      -                     -                       -           154,263
                    Total adjustments                              (138,032)              2,582         932,196           278,407        2,099,556
                      Net cash provided (used) by operating activities  $  1,201,141  $      478,091  $  1,381,131  $   (2,007,964)  $    3,984,365


                                                              169