Page 170 - 2018 Comprehensive Annual Financial Report - City of Winston-Salem
P. 170

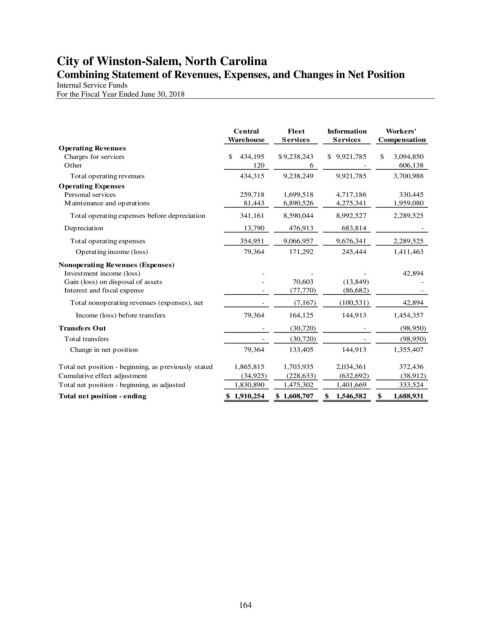
City of Winston-Salem, North Carolina
               Combining Statement of Revenues, Expenses, and Changes in Net Position

               Internal Service Funds
               For the Fiscal Year Ended June 30, 2018


                                                             Central      Fleet      Information   Workers'
                                                           Warehouse     Services     Services    Compensation
                Operating Revenues
                 Charges for services                      $      434,195  $  9,238,243  $    9,921,785  $       3,094,850
                 Other                                                    120                    6                       -              606,138
                   Total operating revenues                        434,315      9,238,249        9,921,785           3,700,988
                Operating Expenses
                 Personal services                                 259,718      1,699,518        4,717,186              330,445
                 Maintenance and operations                          81,443      6,890,526        4,275,341           1,959,080
                   Total operating expenses before depreciation          341,161      8,590,044        8,992,527           2,289,525
                 Depreciation                                        13,790         476,913           683,814                         -
                   Total operating expenses                        354,951      9,066,957        9,676,341           2,289,525
                    Operating income (loss)                          79,364         171,292           245,444           1,411,463
                Nonoperating Revenues (Expenses)
                 Investment income (loss)                                     -                     -                       -                42,894
                 Gain (loss) on disposal of assets                            -           70,603            (13,849)                         -
                 Interest and fiscal expense                                  -          (77,770)            (86,682)                         -
                   Total nonoperating revenues (expenses), net                     -            (7,167)          (100,531)                42,894
                    Income (loss) before transfers                   79,364         164,125           144,913           1,454,357
                Transfers Out                                                 -          (30,720)                       -              (98,950)
                 Total transfers                                              -          (30,720)                       -              (98,950)
                   Change in net position                            79,364         133,405           144,913           1,355,407

                Total net position - beginning, as previously stated       1,865,815      1,703,935        2,034,361              372,436
                Cumulative effect adjustment                       (34,925)        (228,633)          (632,692)              (38,912)
                Total net position - beginning, as adjusted       1,830,890      1,475,302        1,401,669              333,524
                Total net position - ending                $    1,910,254  $    1,608,707  $      1,546,582  $        1,688,931


                                                              164
   165   166   167   168   169   170   171   172   173   174   175