
Page 173 - 2018 Comprehensive Annual Financial Report - City of Winston-Salem
P. 173
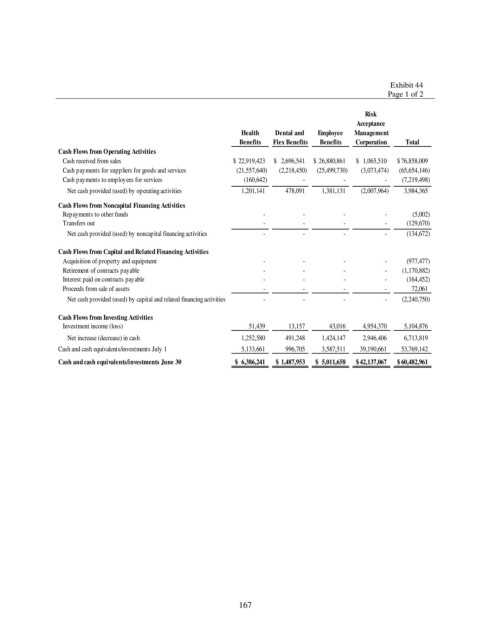
Exhibit 44
                                                                                                    Page 1 of 2

                                                                                              Risk
                                                                                            Acceptance
                                                               Health  Dental and   Employee  Management
                                                              Benefits  Flex Benefits  Benefits  Corporation  Total
                Cash Flows from Operating Activities
                 Cash received from sales                   $   22,919,423  $     2,696,541  $   26,880,861  $    1,065,510  $  76,858,009
                 Cash payments for suppliers for goods and services     (21,557,640)      (2,218,450)     (25,499,730)       (3,073,474)     (65,654,146)
                 Cash payments to employees for services             (160,642)                      -                       -                       -       (7,219,498)
                  Net cash provided (used) by operating activities        1,201,141          478,091        1,381,131       (2,007,964)        3,984,365
                Cash Flows from Noncapital Financing Activities
                 Repayments to other funds                                        -                      -                       -                       -              (5,002)
                 Transfers out                                                    -                      -                       -                       -          (129,670)
                  Net cash provided (used) by noncapital financing activities                       -                      -                       -                       -          (134,672)

                Cash Flows from Capital and Related Financing Activities
                 Acquisition of property and equipment                            -                      -                       -                       -          (977,477)
                 Retirement of contracts payable                                  -                      -                       -                       -       (1,170,882)
                 Interest paid on contracts payable                               -                      -                       -                       -          (164,452)
                 Proceeds from sale of assets                                     -                      -                       -                       -             72,061
                  Net cash provided (used) by capital and related financing activities                       -                      -                       -                       -       (2,240,750)

                Cash Flows from Investing Activities
                 Investment income (loss)                               51,439            13,157             43,016        4,954,370        5,104,876
                  Net increase (decrease) in cash                  1,252,580          491,248        1,424,147        2,946,406        6,713,819
                Cash and cash equivalents/investments July 1        5,133,661          996,705        3,587,511      39,190,661      53,769,142
                Cash and cash equivalents/investments June 30  $    6,386,241  $   1,487,953  $    5,011,658  $  42,137,067  $  60,482,961


                                                              167