
Page 171 - 2018 Comprehensive Annual Financial Report - City of Winston-Salem
P. 171
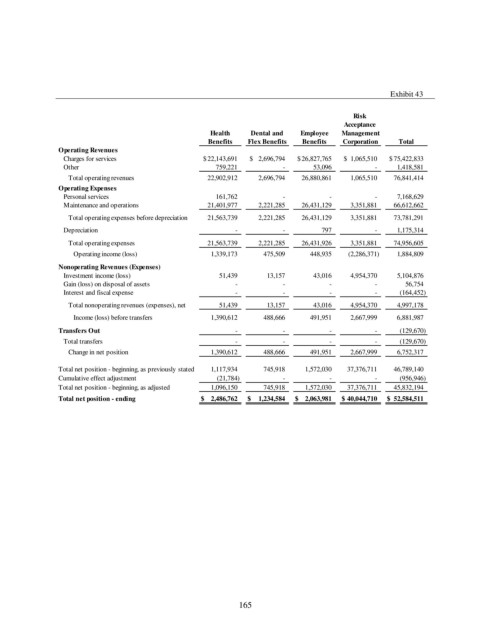
Exhibit 43

                                                                                           Risk
                                                                                         Acceptance
                                                       Health    Dental and   Employee  Management
                                                      Benefits  Flex Benefits  Benefits  Corporation   Total
                Operating Revenues
                 Charges for services                $  22,143,691  $     2,696,794  $  26,827,765  $    1,065,510  $  75,422,833
                 Other                                        759,221                        -             53,096                      -        1,418,581
                  Total operating revenues               22,902,912         2,696,794      26,880,861        1,065,510      76,841,414
                Operating Expenses
                 Personal services                            161,762                        -                       -                      -        7,168,629
                 Maintenance and operations              21,401,977         2,221,285      26,431,129        3,351,881      66,612,662
                  Total operating expenses before depreciation      21,563,739         2,221,285      26,431,129        3,351,881      73,781,291
                 Depreciation                                             -                        -                  797                      -        1,175,314
                  Total operating expenses               21,563,739         2,221,285      26,431,926        3,351,881      74,956,605
                    Operating income (loss)                1,339,173            475,509           448,935      (2,286,371)        1,884,809
                Nonoperating Revenues (Expenses)
                 Investment income (loss)                       51,439              13,157             43,016        4,954,370        5,104,876
                 Gain (loss) on disposal of assets                        -                        -                       -                      -             56,754
                 Interest and fiscal expense                              -                        -                       -                      -          (164,452)
                  Total nonoperating revenues (expenses), net             51,439              13,157             43,016        4,954,370        4,997,178
                    Income (loss) before transfers         1,390,612            488,666           491,951        2,667,999        6,881,987
                Transfers Out                                             -                        -                       -                      -          (129,670)
                 Total transfers                                          -                        -                       -                      -          (129,670)
                  Change in net position                   1,390,612            488,666           491,951        2,667,999        6,752,317

                Total net position - beginning, as previously stated        1,117,934            745,918        1,572,030      37,376,711      46,789,140
                Cumulative effect adjustment                   (21,784)                        -                       -                      -          (956,946)
                Total net position - beginning, as adjusted        1,096,150            745,918        1,572,030      37,376,711      45,832,194
                Total net position - ending         $      2,486,762  $      1,234,584  $      2,063,981  $   40,044,710  $    52,584,511


                                                              165